
Welcome to an in-depth guide on mastering algorithmic futures trading with NinjaTrader, inspired by the expert insights of Vinny Emini. This comprehensive tutorial walks you through the fundamental tools, indicators, and strategies you need to understand to trade smarter and more effectively using the AlgoBox suite. Whether you’re a beginner or an experienced trader looking to refine your skills, this step-by-step tutorial will equip you with practical knowledge and actionable steps to elevate your trading game.
Table of Contents
- Step 1: Understanding the Order of Operations (OOP)
- Step 2: Preparing Your Charts and Tools
- Step 3: Utilizing the Position Details Indicator
- Step 4: Mastering the Button Panel for Trade Execution
- Step 5: Enhancing Your Trading Psychology with the Speedometer Module
- Step 6: Understanding Bid and Ask Lines for Spread Awareness
- Step 7: Using the Channel Regulator for Market Structure
- Step 8: Leveraging Chart Labeler and Current Day OHL Indicators
- Step 9: The Golden Ropes and Rivers of Life – Moving Averages and Zones
- Step 10: Mastering the MACV Chart and No Fiddle Zone
- Step 11: Utilizing the MACVU – Market Direction Across Instruments
- Step 12: Advanced Indicators – FibElliDotts and Piercer Plays
- Step 13: Harmonic Patterns – Automated Geometric Price Structures
- Step 14: Flowmaster Suite – Real-Time Order Flow Analysis Tools
- Step 15: Enigma Bot and Dream Panel – Automation and Execution
- Step 16: Flowmaster AudioBox – Trading with Sound
- Step 17: Speedy Chart – Optimizing Chart Refresh Rates
- Step 18: Ultimate OBOS Divergence Indicator
- Step 19: Volume Profiler – Identifying Caves and Nodes
- Step 20: Chart Notes – Keeping Your Trading Disciplined
- Conclusion: Mastering AlgoBox Fundamentals for Better Trading
Step 1: Understanding the Order of Operations (OOP)
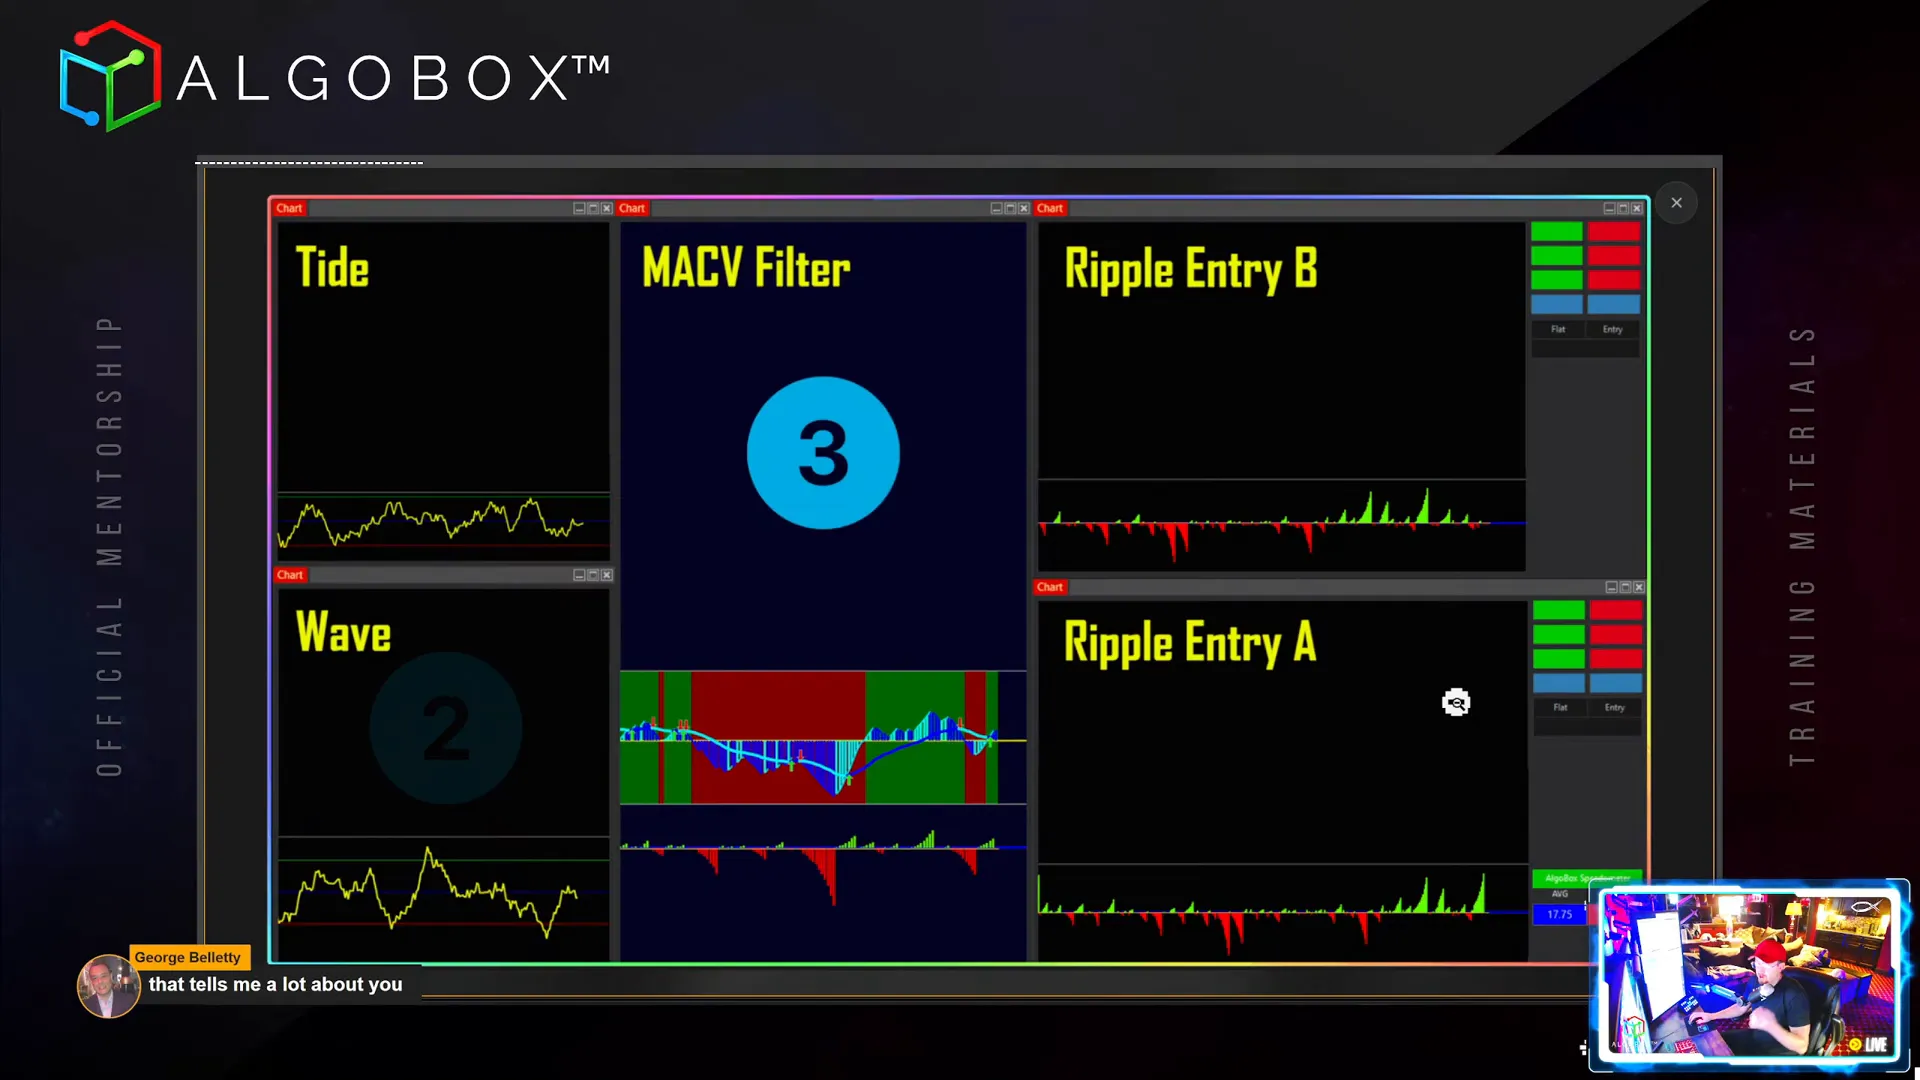
The foundation of successful trading lies in respecting the Order of Operations (OOP). This concept is pivotal in determining when and how to enter trades effectively. The OOP consists of multiple layers that filter trades based on market context, ensuring you only engage in setups with the highest probability of success.
Vinny emphasizes the importance of starting with the big picture, known as the tide, which represents the overall market direction. If the tide is rising, it generally lifts all instruments – Nasdaq, ES, RTY, Dow, and the combined “nerd” index – suggesting a bullish environment.
Next is the wave, which can move independently within the tide. For example, even if the tide is up, the wave may be crashing down, offering opportunities to trade counter-trend moves with proper sizing and risk management.
The final filter is the MACV filter, a sophisticated indicator that acts like a sponge, soaking up order flow information and providing a last check before trade entry. This filter integrates real-time order flow data with volume and price action to fine-tune entry timing.
Remember, the OOP is not about taking every trade but about assessing your “hand” and playing it wisely, much like poker players decide when to bet or fold based on their cards and position.
Step 2: Preparing Your Charts and Tools
Before diving into trading, ensure your NinjaTrader charts are optimally set up. One crucial aspect is the Chart Trader panel, which serves as your trade controller. This panel is color-coded out-of-the-box for ease of use, and you can customize colors and settings by right-clicking within the panel area.
Vinny advises never to turn off the Chart Trader, as it is essential for managing trades efficiently. It allows you to add brackets, stops, and flatten positions quickly.
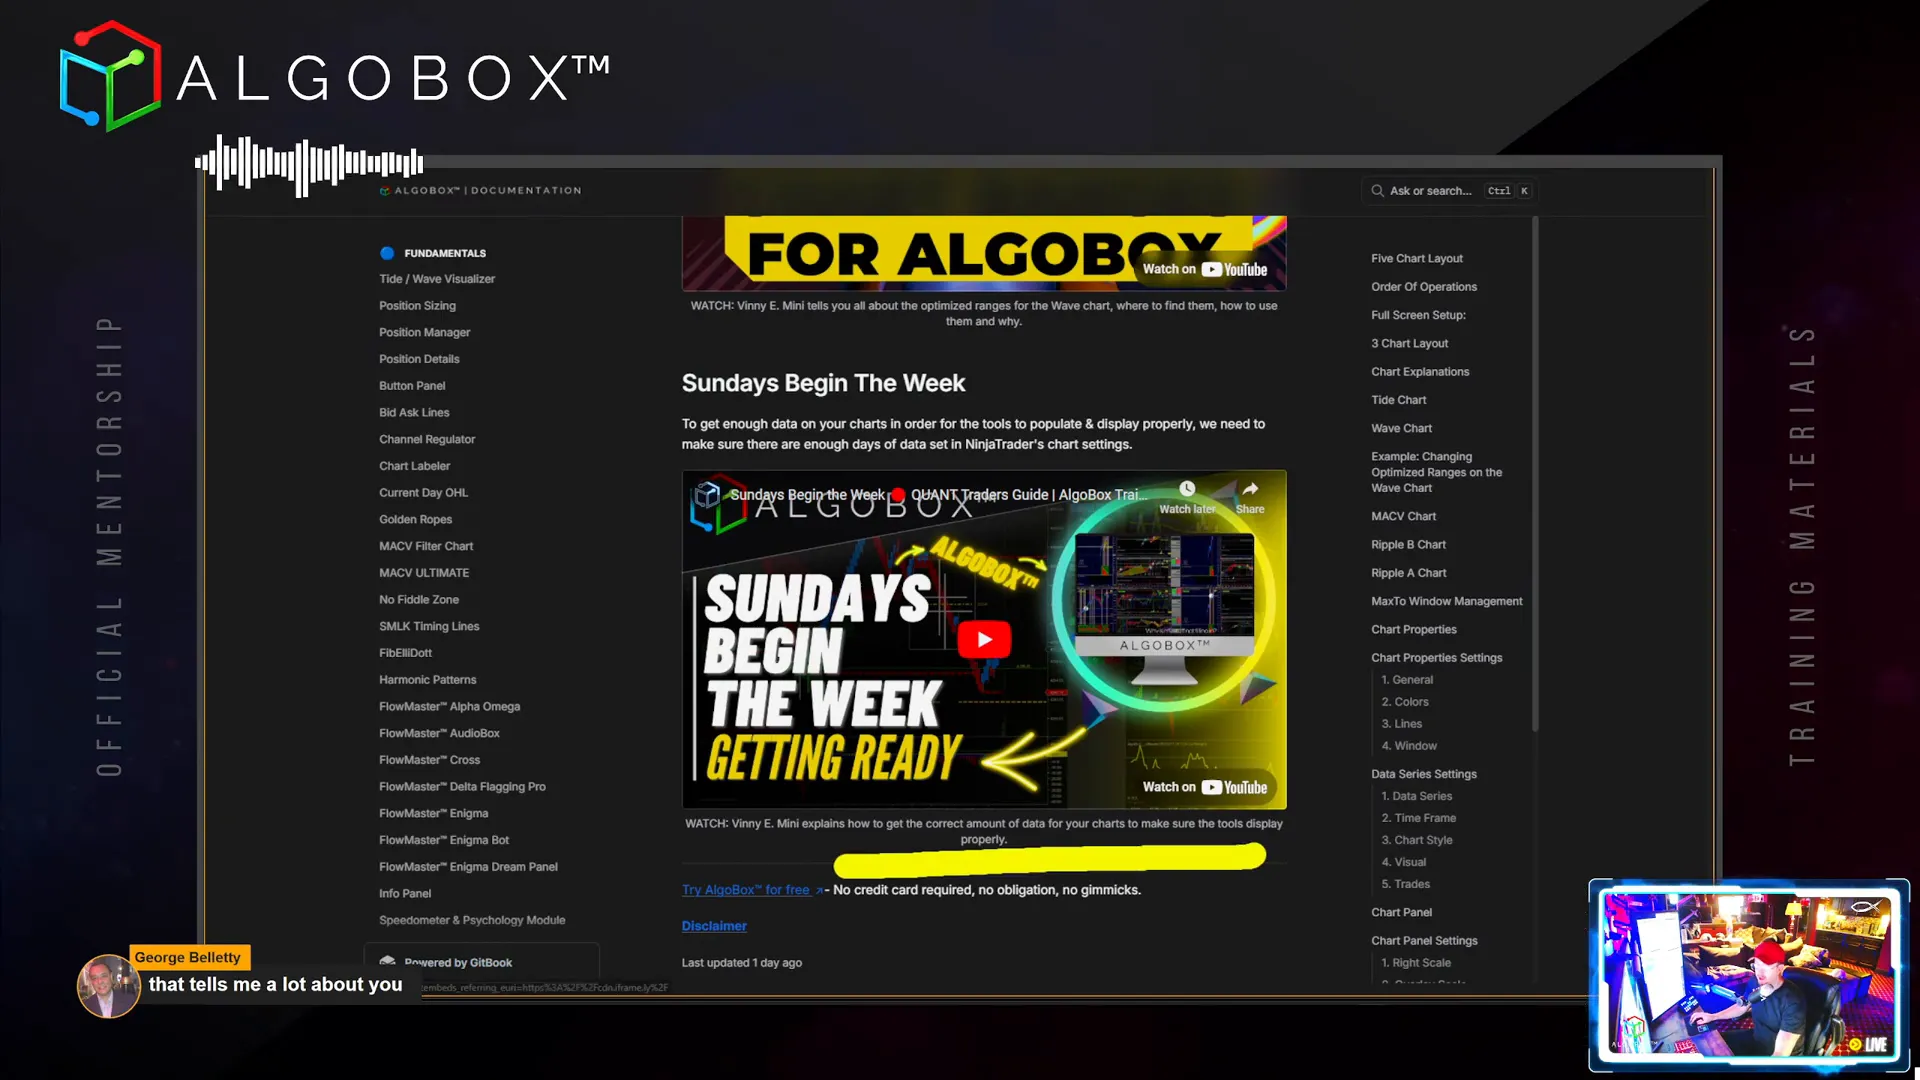
Another vital setup task is adjusting your Days to Load in the NinjaTrader data series. By default, the lowest timeframe charts load only one day of data, which is insufficient for accurate calculations, especially when starting fresh on Sunday night or Monday morning. To ensure your indicators have enough historical bars to function correctly, set this to at least three days, or four if there are holidays in the week.
This adjustment guarantees that your system has enough data to analyze past market behavior and predict future moves effectively.
Step 3: Utilizing the Position Details Indicator
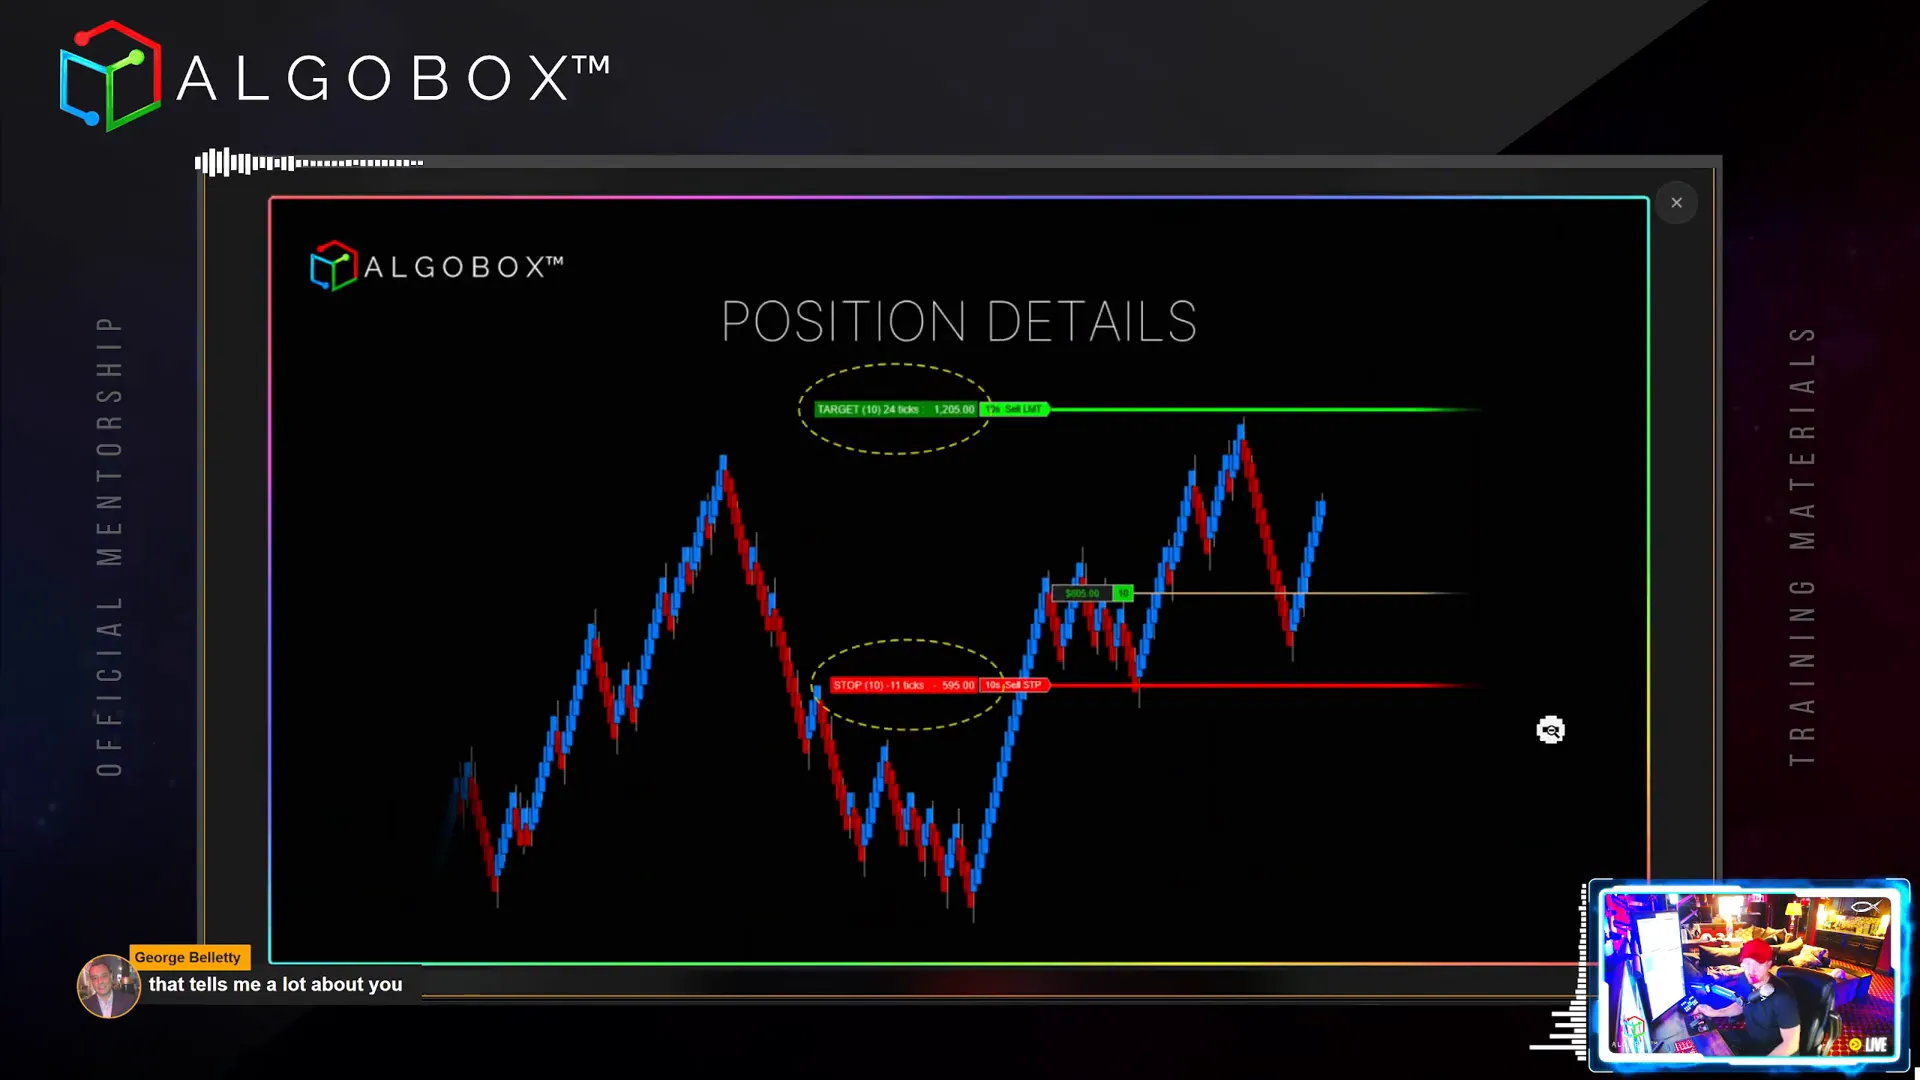
Managing your open positions effectively is key to successful trading. The Position Details Indicator is a custom tool in AlgoBox that enhances NinjaTrader’s native capabilities by providing clear information about your open trades.
This indicator displays how many contracts you have open, your current unrealized profit or loss, and crucially, the distance in ticks to your targets and stops. It calculates the monetary value of these distances based on the instrument’s tick size, allowing you to see your potential risk and reward at a glance.
You can have multiple targets set on your position, and the indicator will show the details for each, helping you manage complex scaling strategies with ease.
Vinny recommends setting the indicator to update on each tick if your computer can handle it, for the most responsive information. If your system is slower, updating on price changes is acceptable.
Step 4: Mastering the Button Panel for Trade Execution
The Button Panel in AlgoBox is your command centre for rapid trade execution and management. It includes several key functions:
- Bracket: Adds stop loss and target orders around your current position automatically, based on your contract count.
- Add Stop: Allows you to place a stop loss order manually.
- Naked: Removes all bracket orders, useful if you want to manage your position manually without preset stops or targets.
- Flatten All: Closes all open positions across all instruments in your account quickly, invaluable for managing multiple trades during volatile periods.
- Half and Double: Adjust your position size on the fly, halving or doubling your current contracts with a single button press.
Hotkeys can be assigned to these buttons for even faster access, and color customization allows you to tailor the panel to your preferences.
Remember, these buttons send market orders, so be mindful of slippage during fast market moves.

Step 5: Enhancing Your Trading Psychology with the Speedometer Module
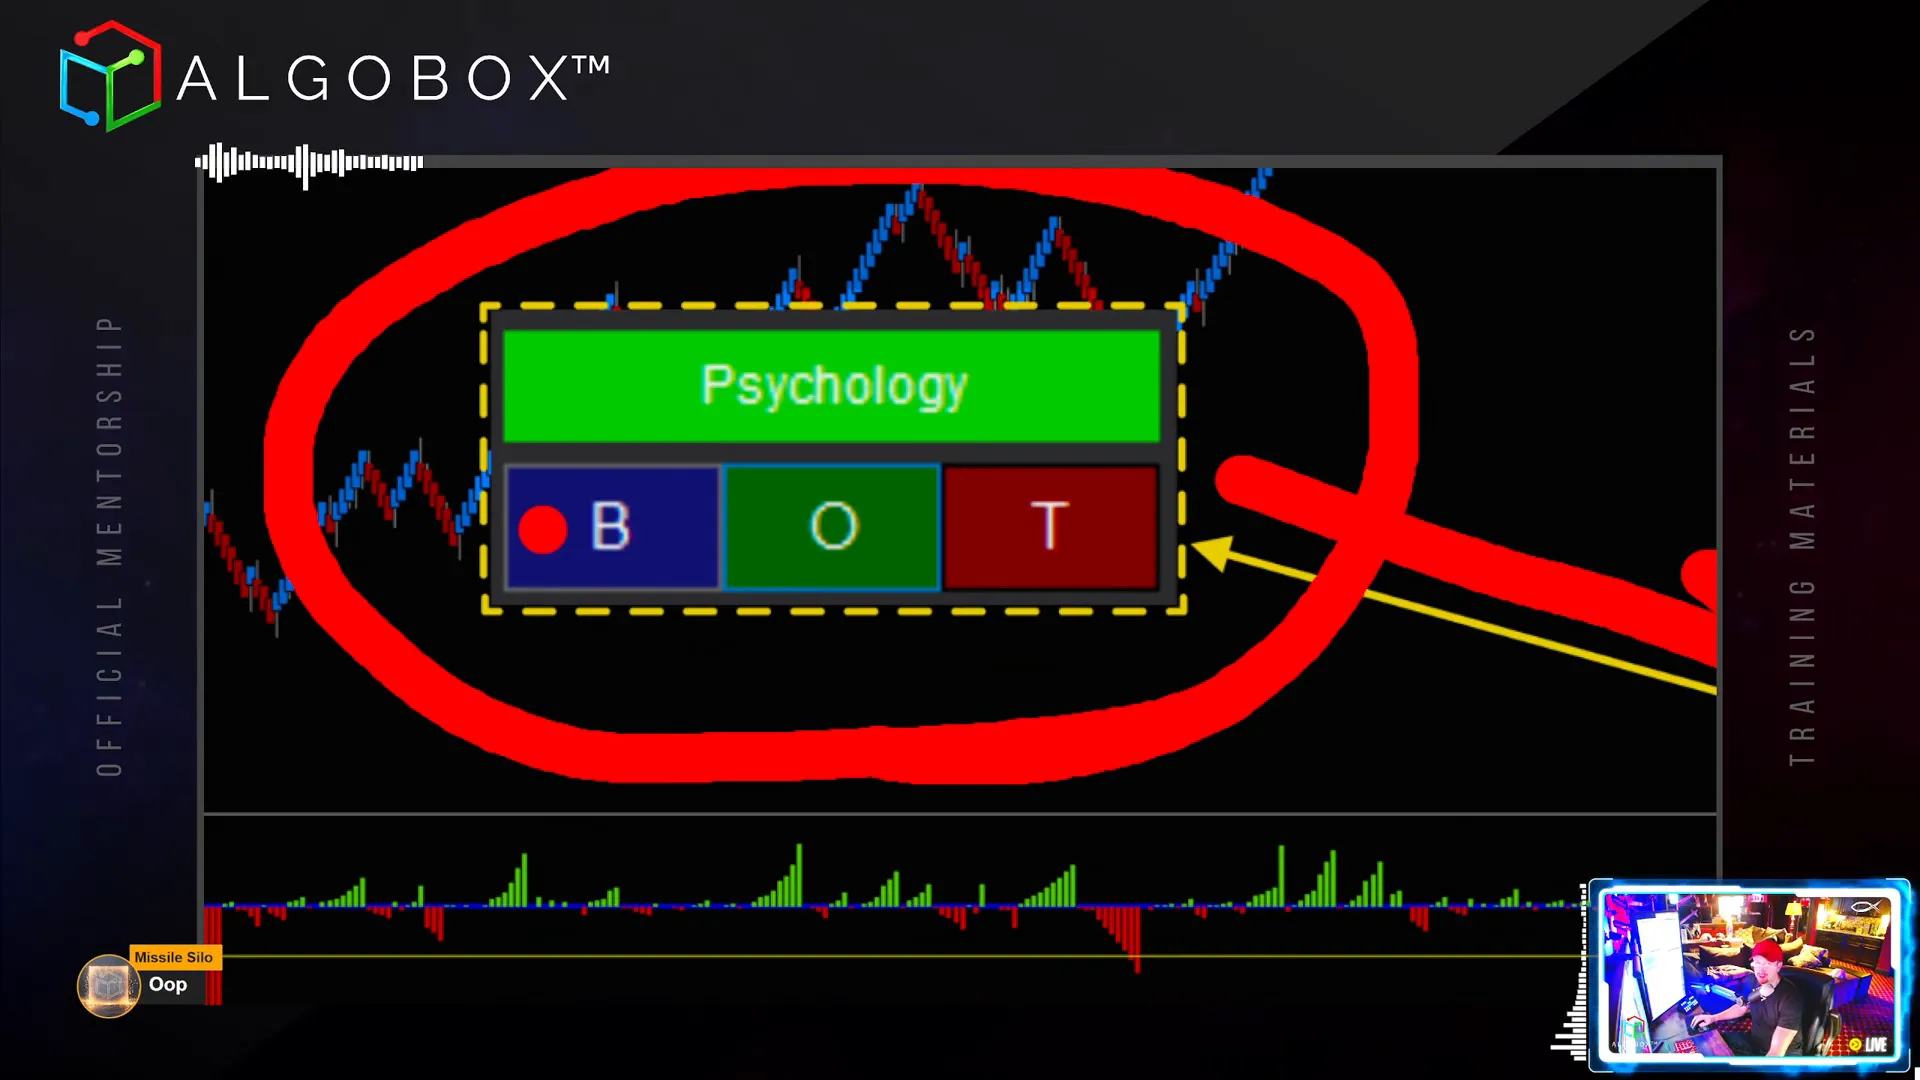
Trading discipline is often what separates consistent winners from others. The Speedometer and Psychology Module in AlgoBox helps you quantify market speed objectively, guiding you on when to trade or stay out.
This module measures bars per minute (BPM) to indicate market pace. It provides visual and audio cues, including:
- Background Color: A red background signals that the market is moving too fast or too slow, suggesting you should avoid trading.
- Overlay: Displays a large ‘X’ to visually block out the chart during unfavorable conditions.
- Text: Provides messages like “Too Slow,” “Valid Speed,” or “Too Fast” to communicate the current market state.
You can enable any combination of these features to suit your style. The module is especially useful for novice traders who struggle with timing their entries and exits.
Vinny calls this the “Medusa effect” – a visual deterrent from overtrading when the market conditions are poor.
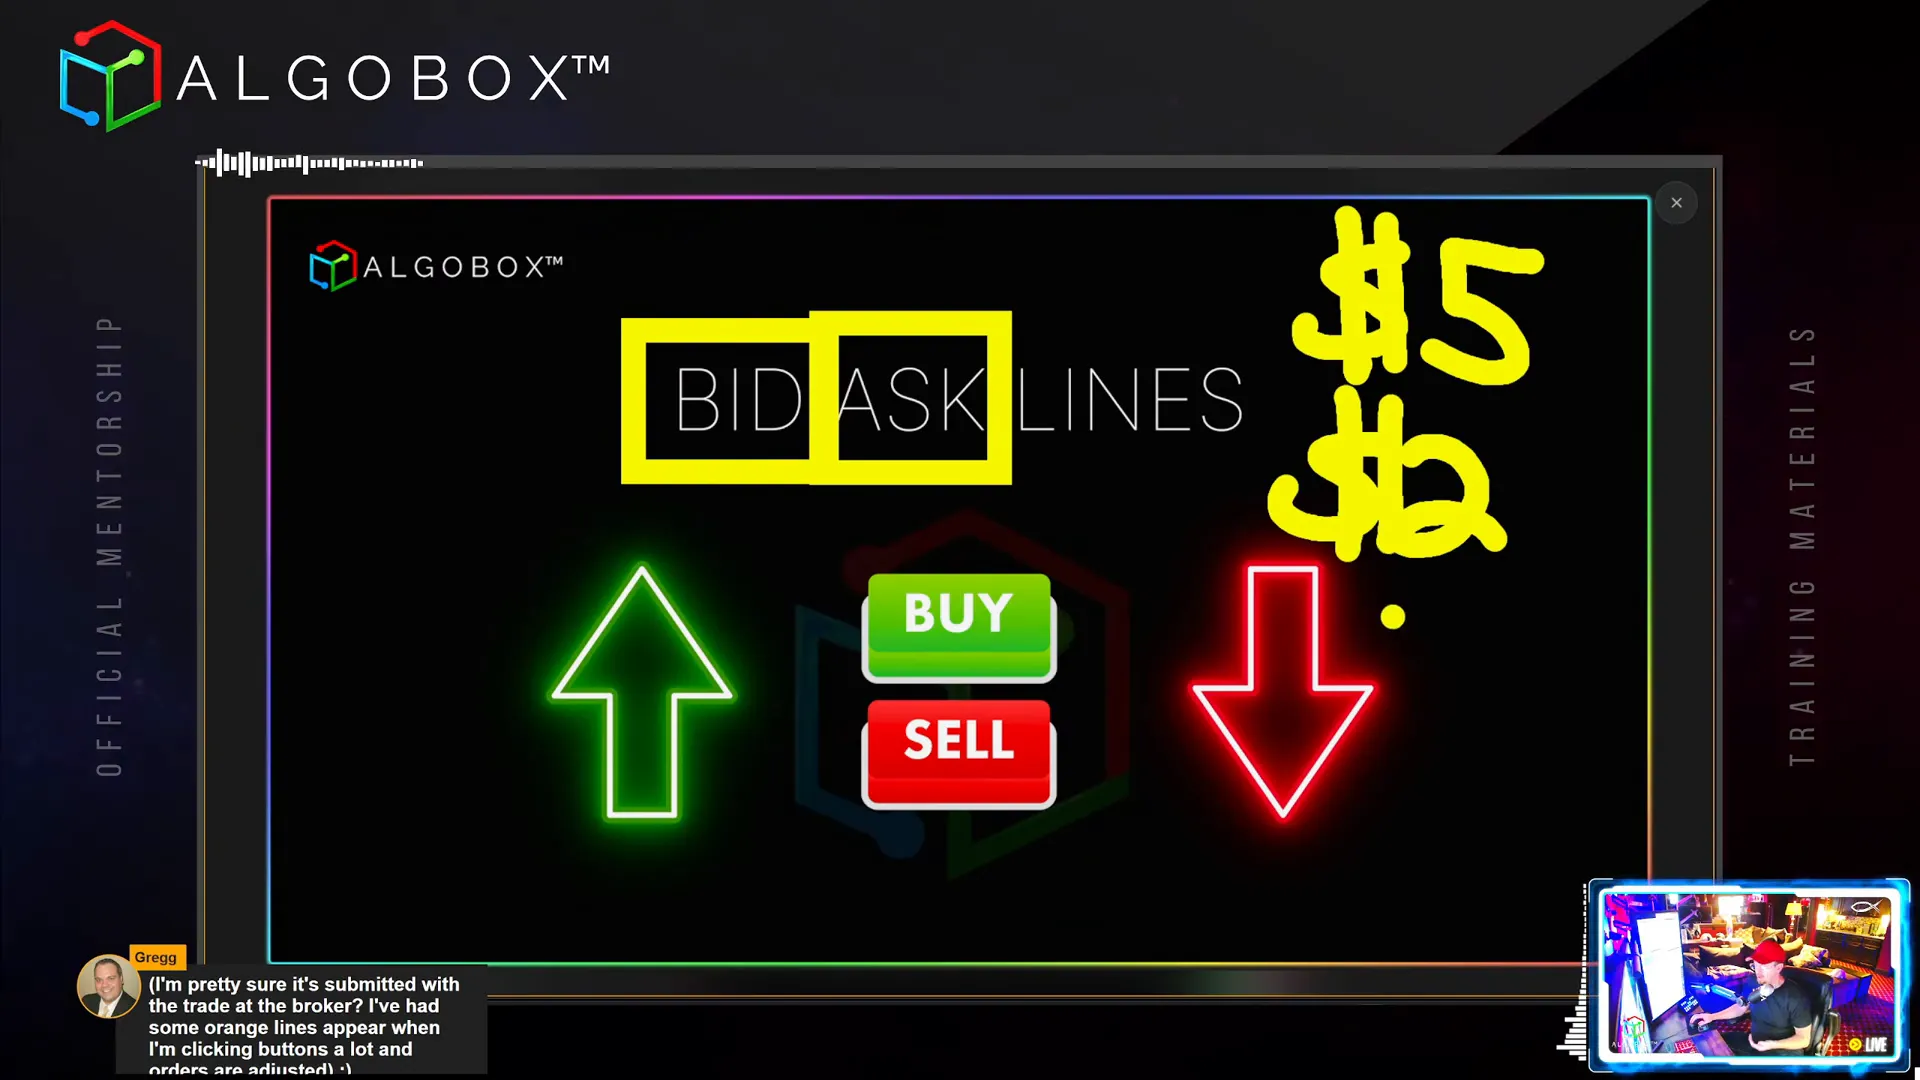
Step 6: Understanding Bid and Ask Lines for Spread Awareness
The Bid and Ask Lines indicator visually represents the spread between buyers and sellers on your chart. This is crucial for understanding market liquidity and potential slippage, especially during thinly traded sessions or after-hours.
Vinny explains the bid as the highest price buyers are willing to pay and the ask as the lowest price sellers are willing to accept. The distance between these lines is the spread, which can sometimes be several ticks wide, translating to significant cost per contract.
By enabling this indicator, you can visually monitor spread changes and avoid entering trades when spreads are abnormally wide, protecting your capital from excessive trading costs.
Step 7: Using the Channel Regulator for Market Structure
The Channel Regulator is a fan favourite for quickly identifying market structure. It automatically draws price channels and color-codes them based on market direction shifts (red to green or vice versa).
These channels act as dynamic support and resistance zones where you can place orders aligned with the order flow events (RTOFA). Vinny advises combining channel signals with other structural confirmations like harmonic PRZs for higher probability entries.
The key setting to understand here is the width, which is based on standard deviations over a set number of bars (default 204). Adjusting this can fine-tune the channel sensitivity.
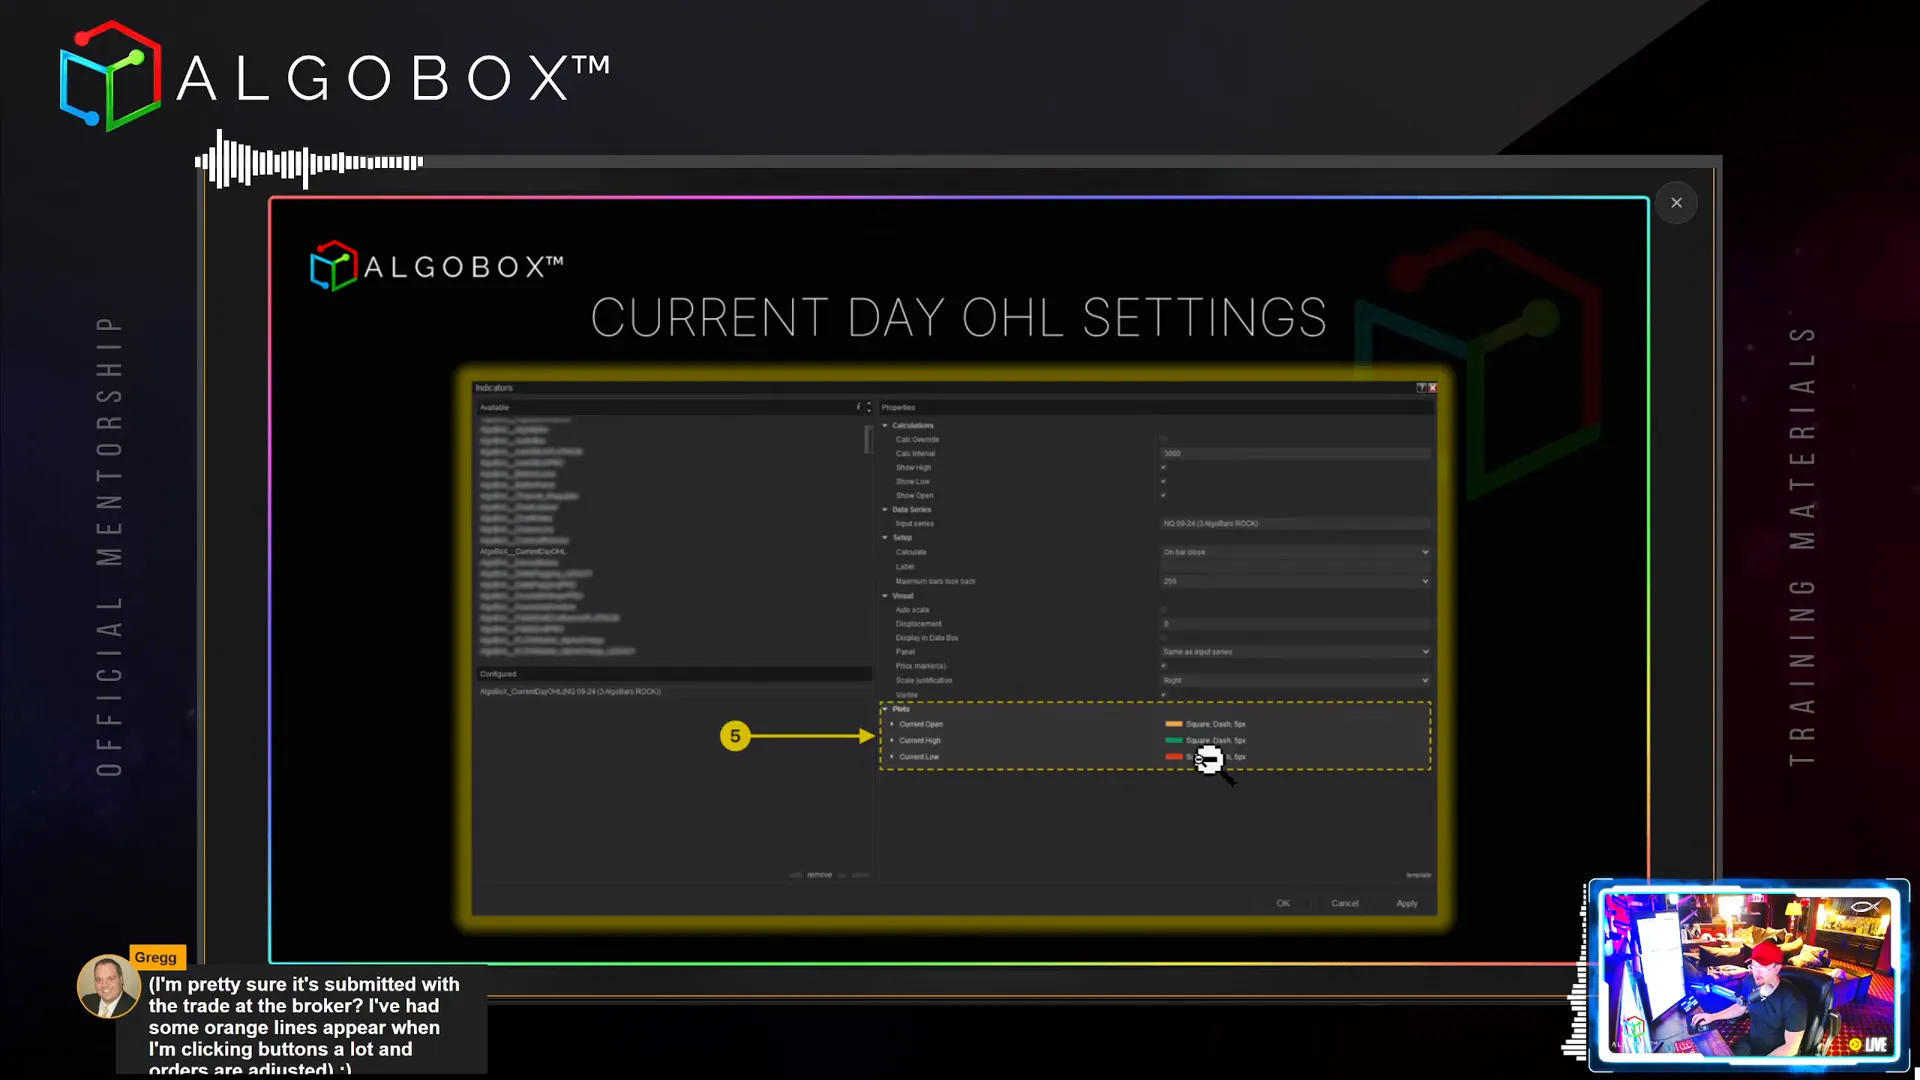
Step 8: Leveraging Chart Labeler and Current Day OHL Indicators
The Chart Labeler is a simple yet helpful tool that displays the current instrument’s name prominently on your chart. Customizable font options allow you to match your chart aesthetics.
The Current Day OHL indicator plots the day’s open, high, and low levels with distinct lines. These levels are key reference points for intraday trading decisions, influencing where price might find support or resistance.
Vinny shares that when the market approaches these levels, especially the open, it can act like a magnet, affecting trade bias and stop placement. Understanding the day’s range helps in planning entries and exits more effectively.
Step 9: The Golden Ropes and Rivers of Life – Moving Averages and Zones
The Golden Ropes refer to the 50 and 200 period exponential moving averages (EMAs), widely regarded as key trend indicators. These are drawn on higher timeframes to gauge market direction and momentum.
Vinny cautions against using these EMAs on lower timeframes, as they may clutter your charts without providing meaningful information.
The zones around these EMAs, called Rivers, are particularly useful for strategies like the “Two Finger Salute,” where entries depend on price interaction with these zones.
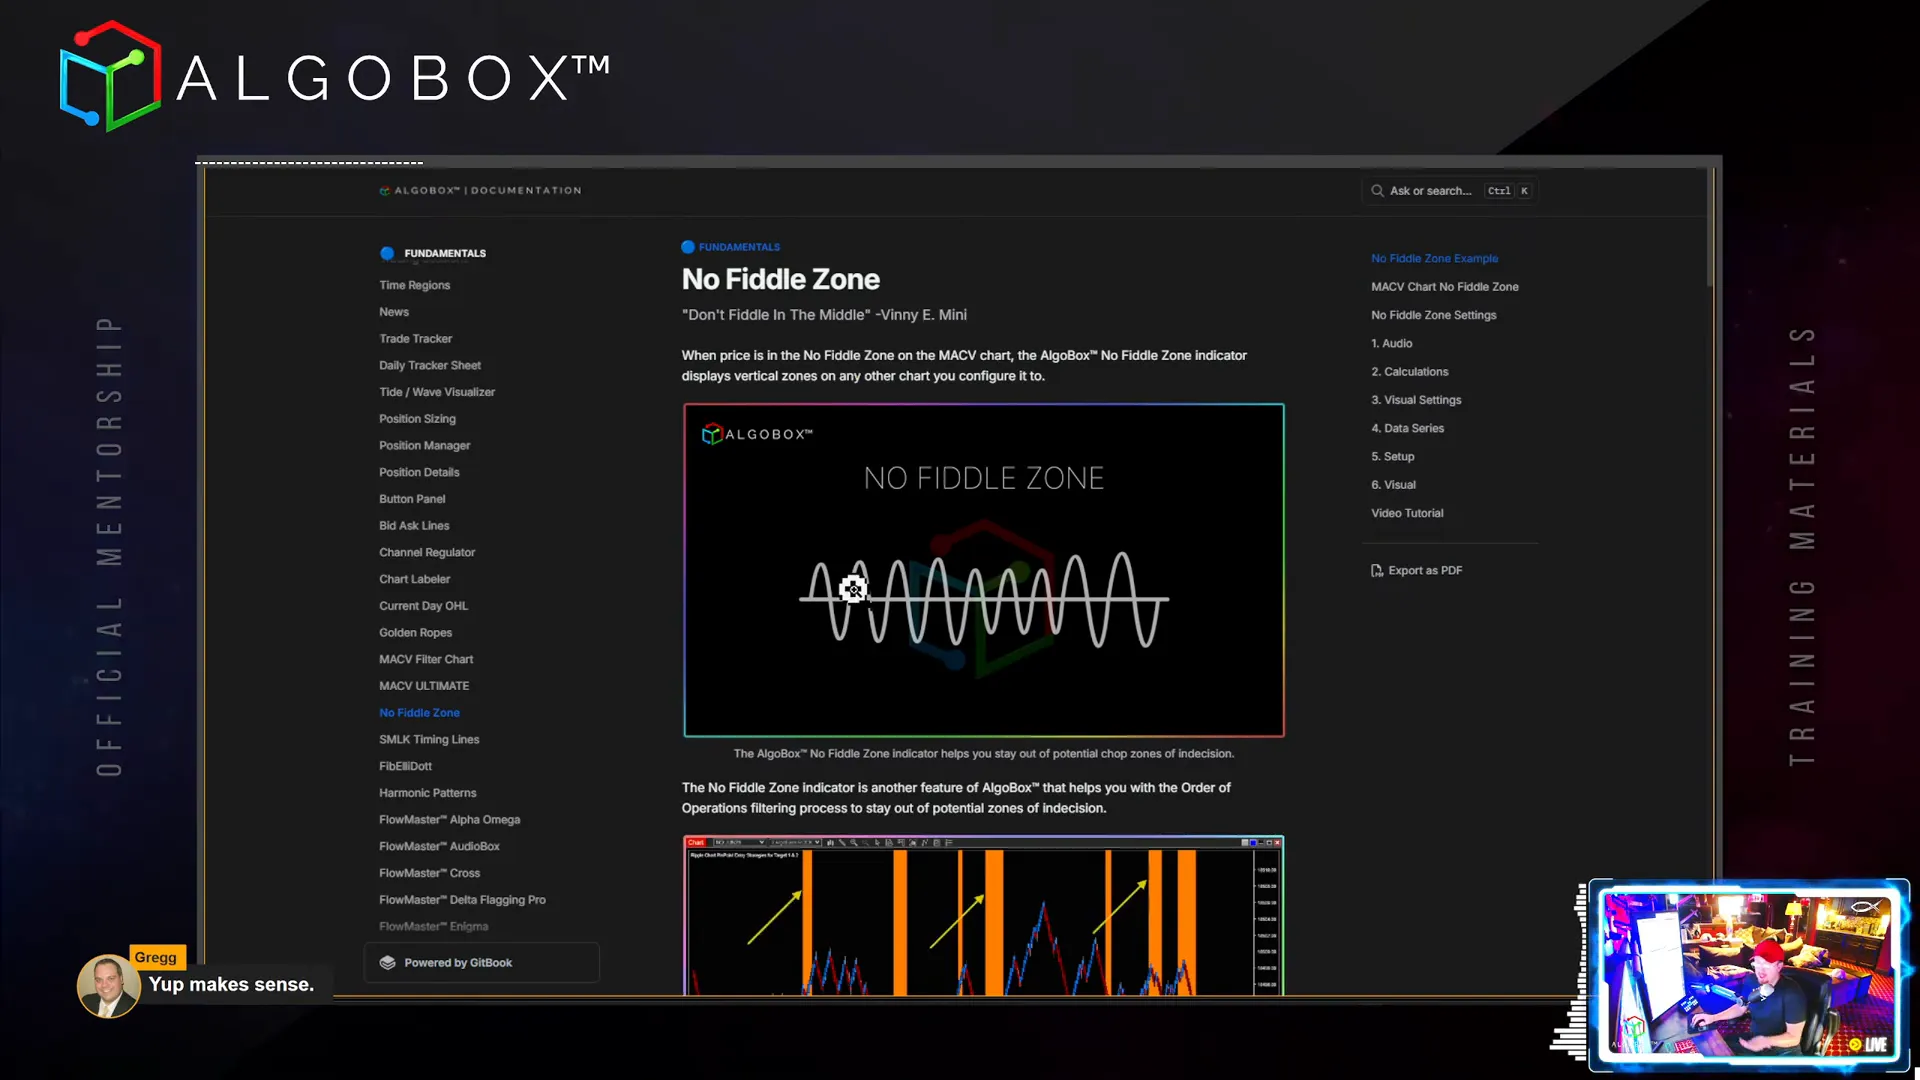
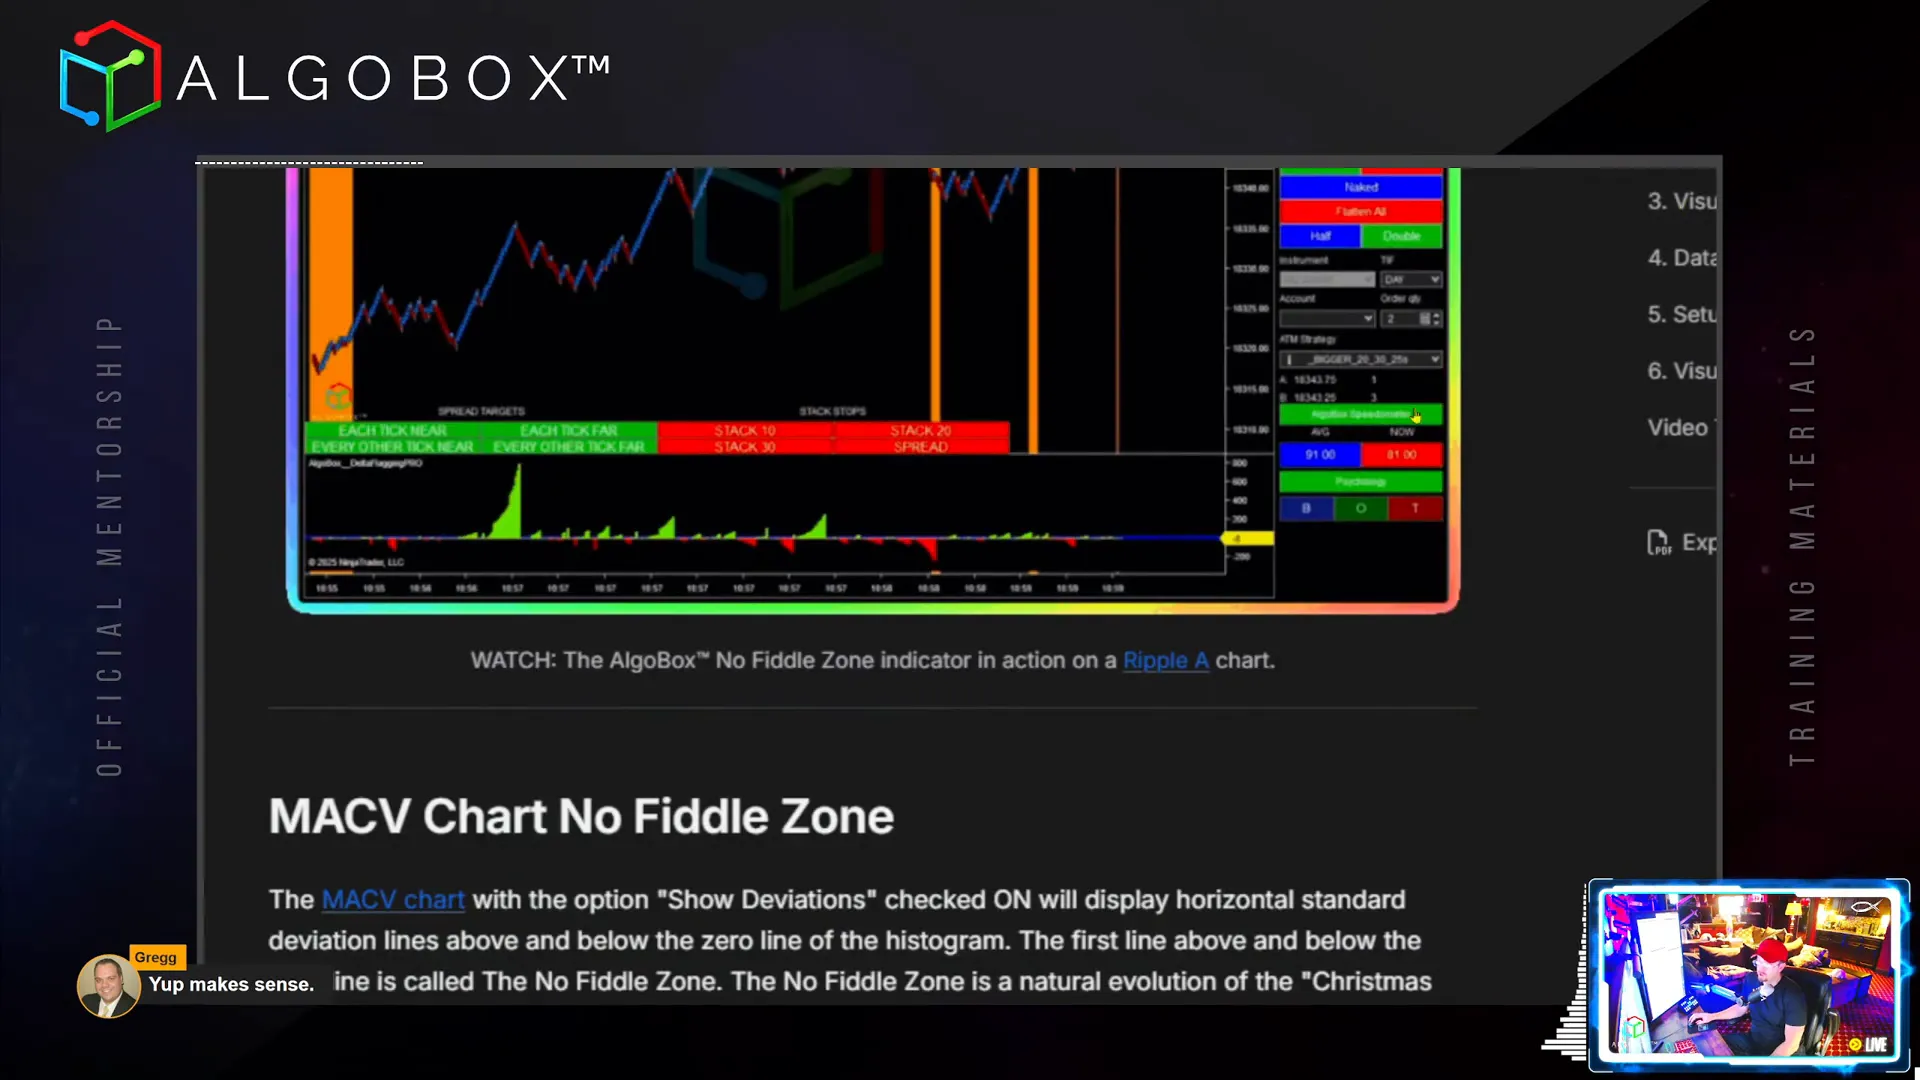
Step 10: Mastering the MACV Chart and No Fiddle Zone
The MACV Chart is a critical component in AlgoBox, analyzing real-time order flow to identify optimal trade zones. It highlights areas like the fiddle zone, where trading is more challenging due to market indecision and noise.
Vinny stresses avoiding trades inside the fiddle zone or using wider stops if trading within it. The chart also features a flat line zone where trade logic may be inverted, offering contrarian opportunities.
The No Fiddle Zone Indicator can be added directly to your entry charts to visually mark these zones, helping you avoid low-probability trades. Ensure your chart has sufficient historical data (at least three days) to display this correctly.
Step 11: Utilizing the MACVU – Market Direction Across Instruments
The MACVU indicator aggregates the order flow signals from the “nerds” – Nasdaq, ES, RTY, and Dow – to provide a combined market direction filter. It categorizes market status into five levels: strong sell, moderate sell, neutral, moderate buy, and strong buy.
Vinny recommends using MACVU as a filter rather than an entry signal alone, helping you align trades with the broader market context.
Step 12: Advanced Indicators – FibElliDotts and Piercer Plays
FibElliDotts combine Fibonacci retracements and Elliott Wave theory across multiple timeframes to highlight potential reversal points. They come in different colors indicating strength, with blue being the most powerful long signal.
Piercer Plays occur when price pierces through these Fibonacci levels or dots, offering precise entry points. Vinny explains how green dot piercers can signal long entries, especially when aligned with higher timeframe filters.
Colorblind-friendly palettes and audio alerts enhance usability for diverse traders.
Step 13: Harmonic Patterns – Automated Geometric Price Structures
AlgoBox automatically plots harmonic patterns such as Gartley, Butterfly, Bat, Crab, Shark, and Cypher, which are based on Fibonacci ratios and geometric shapes. These patterns help identify Potential Reversal Zones (PRZs).
Vinny highlights the Predicted Potential Reversal Zone (PPRZ), a proprietary enhancement that predicts where reversals are likely to occur, using a red-yellow-green light system to indicate readiness.
For performance reasons, you can choose to display only the PRZ boxes without the complex harmonic drawings.
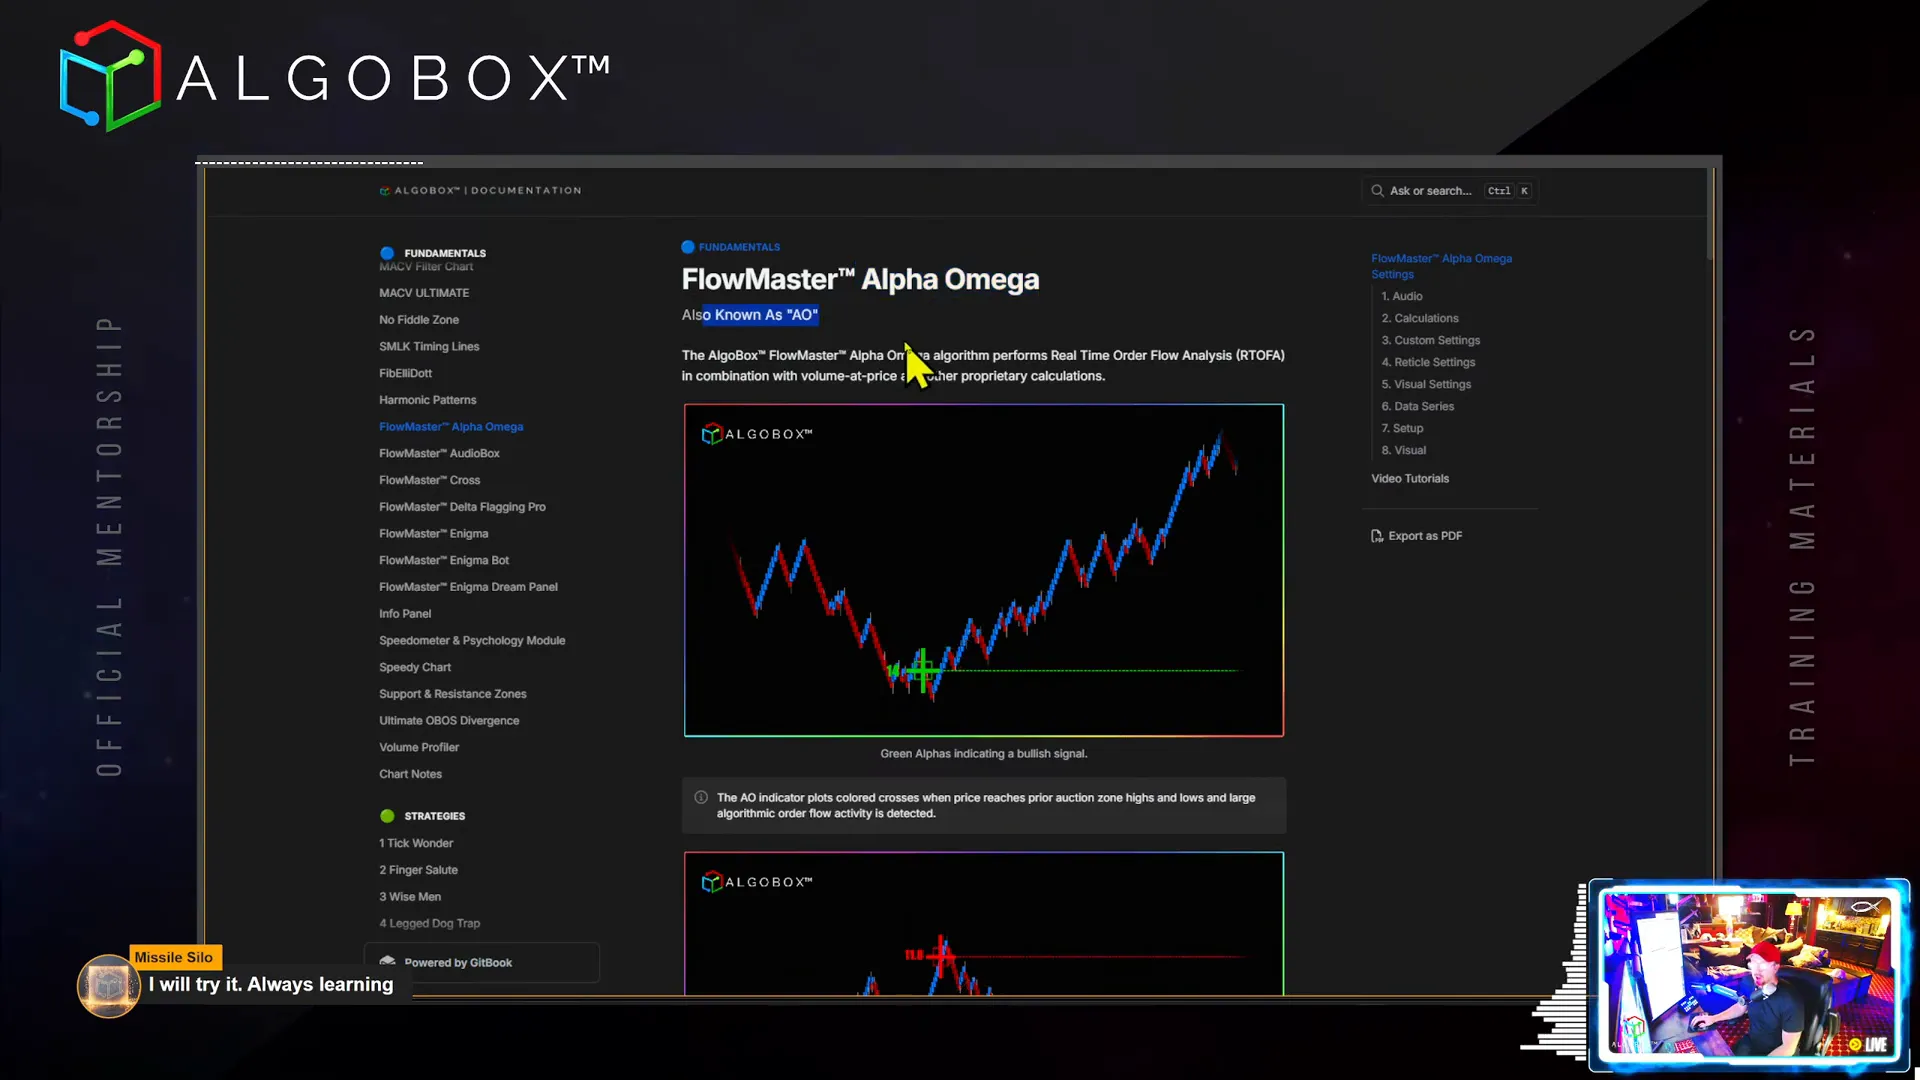
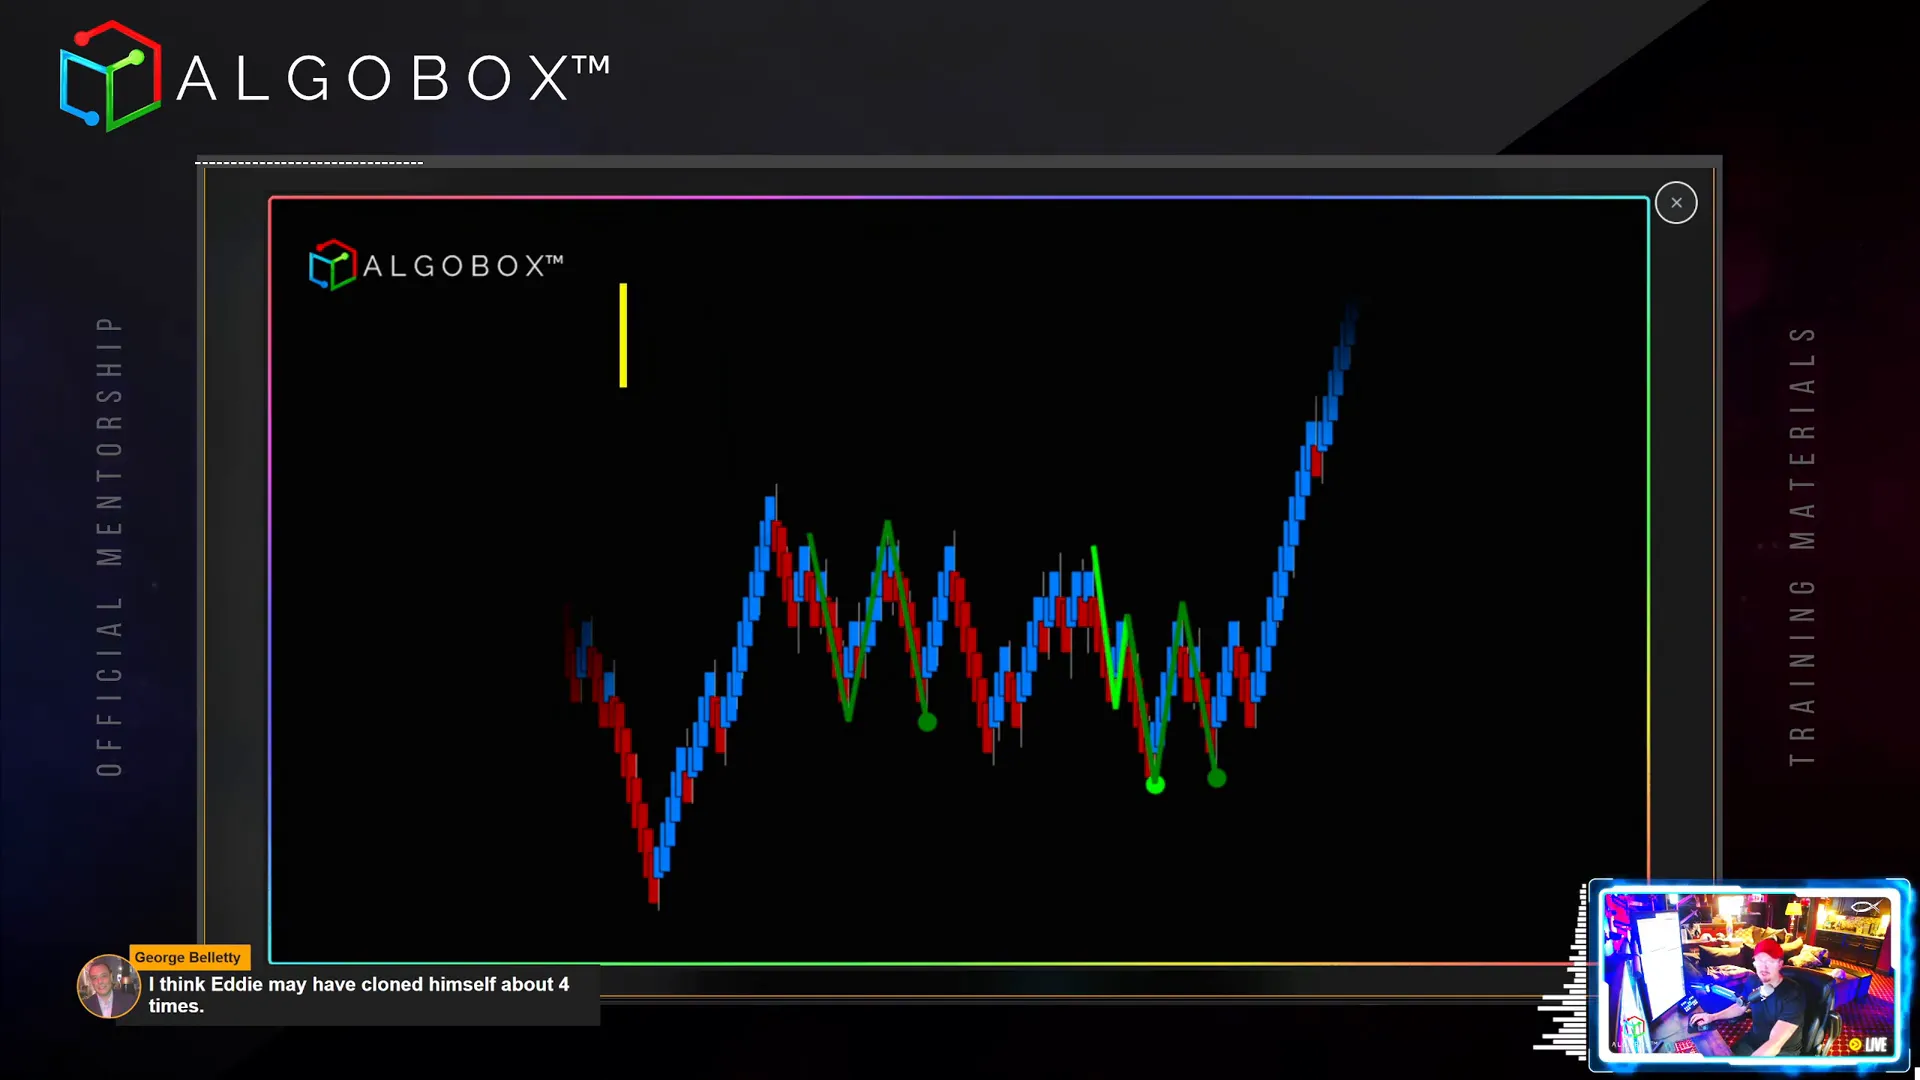
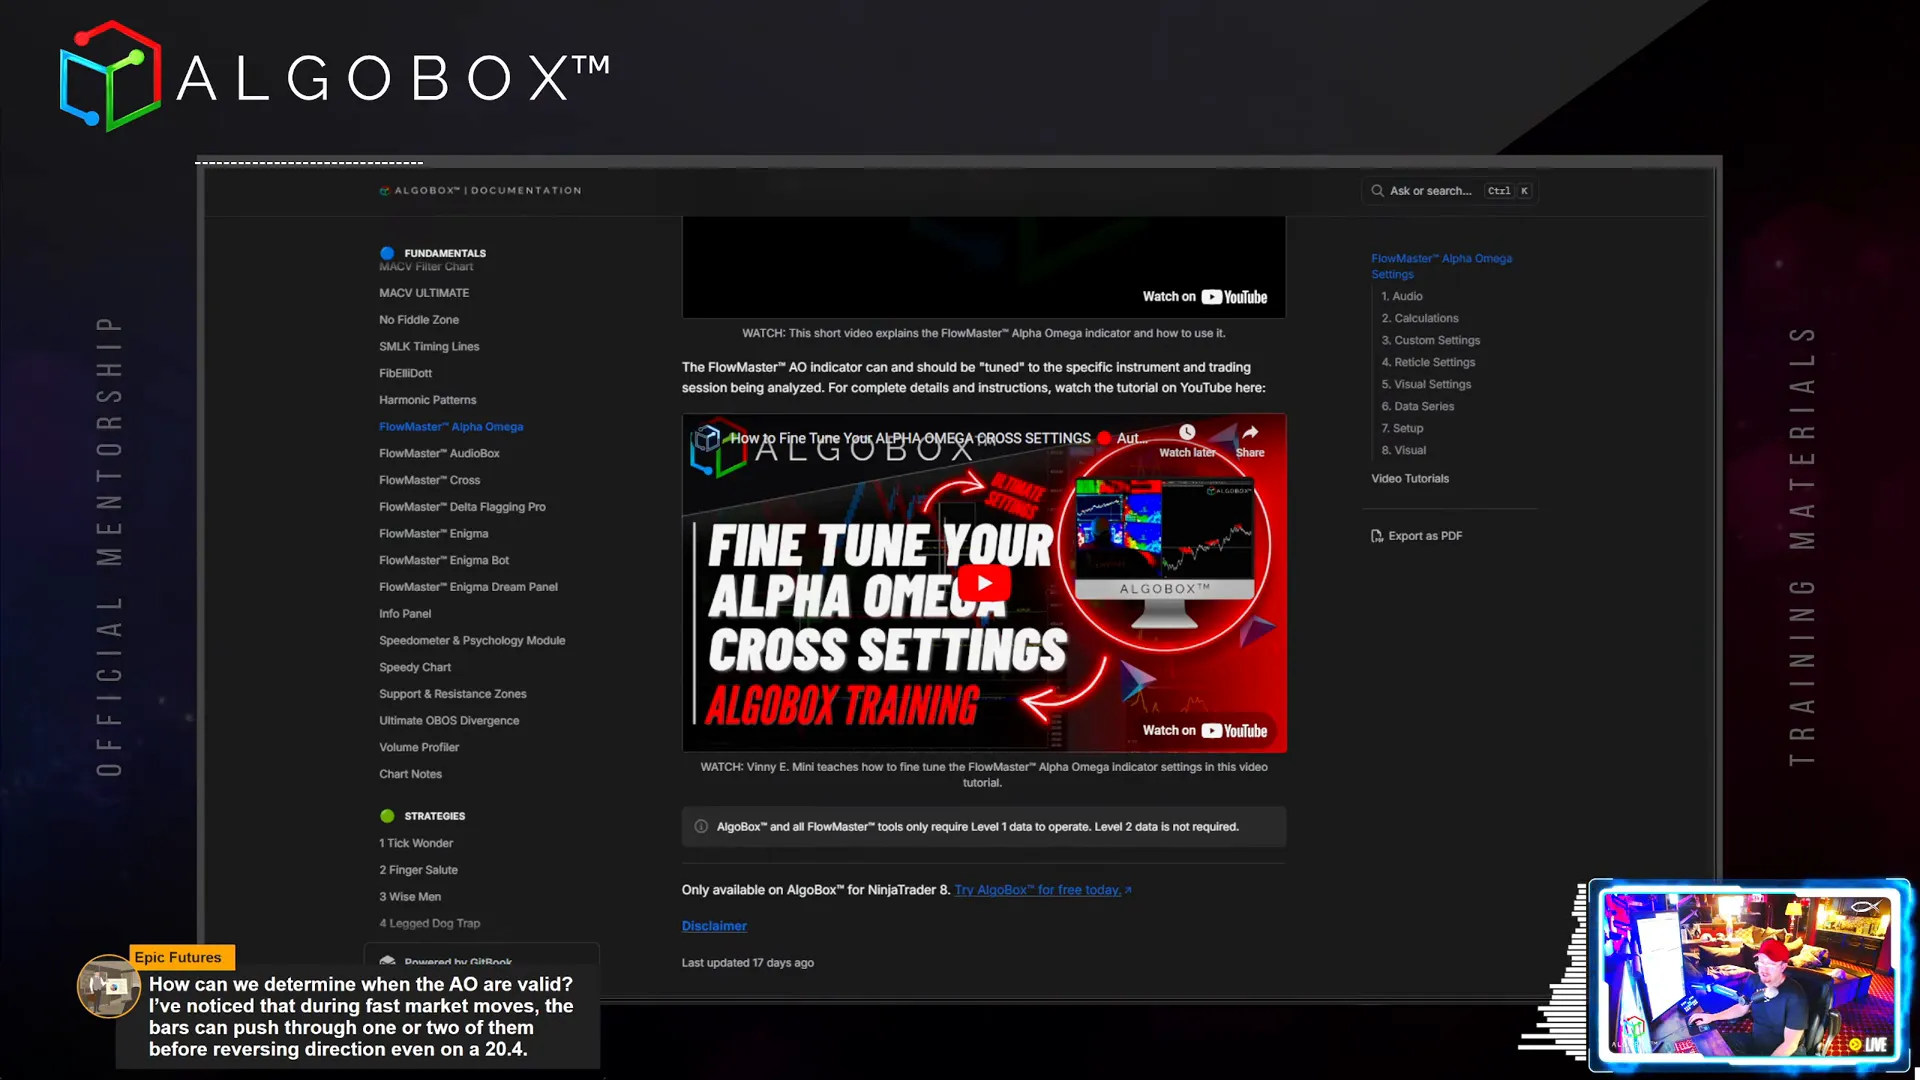
Step 14: Flowmaster Suite – Real-Time Order Flow Analysis Tools
The Flowmaster is a powerful internal engine that processes time and sales data to deliver advanced order flow insights. Key components include:
- Alpha Omega (AO) Crosses: Signals marking the beginning or end of major moves, color-coded by strength.
- Full Master Crosses and Bubbles: Indicate significant order flow events, with some identifying likely retail activity.
- Delta Flagging Pro: Highlights large non-retail order flow activity, including delta shifts signaling potential reversals.
- Enigma Indicator: Proprietary and highly precise order flow signals color-coded by strength, often used in combination with other tools.
Vinny stresses the importance of combining these signals with structural analysis (harmonics, channels) for best results.
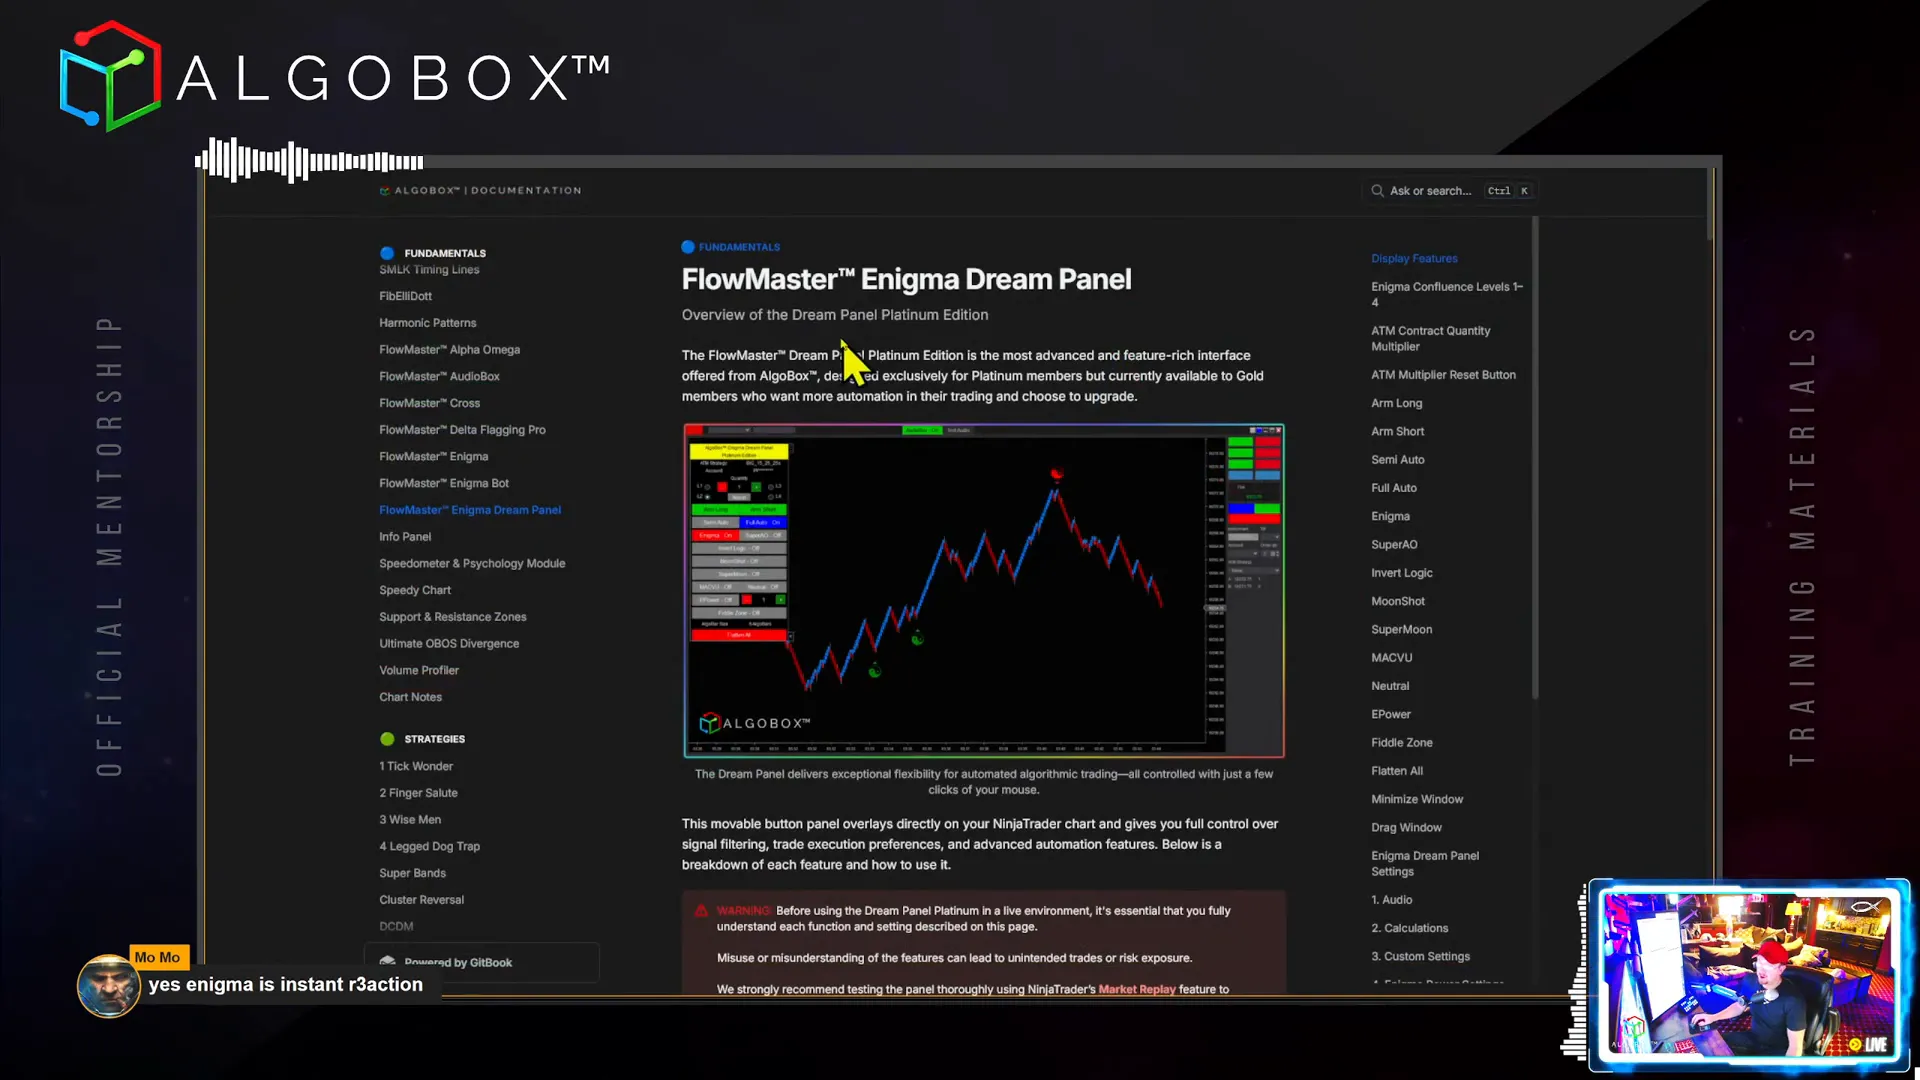
Step 15: Enigma Bot and Dream Panel – Automation and Execution
AlgoBox offers advanced automation tools like the Enigma Bot Panel and the Enigma Dream Panel (Platinum Edition). These panels enable semi-automatic or fully automated trade execution based on real-time order flow signals.
Key features include:
- Arm long/arm short toggles to control trade direction.
- Full auto or semi-auto modes for continuous or single trade execution.
- Signal filtering by confluence levels (L1-L4) to adjust signal strictness.
- Moonshot and Super AO filters to restrict trades to high-probability setups.
- Invert logic option for contrarian trading in specific zones.
- Quantity multipliers controlling contract size per trade.
Vinny advises thorough testing via NinjaTrader’s market replay before live use and emphasizes understanding each feature to avoid unintended risks.
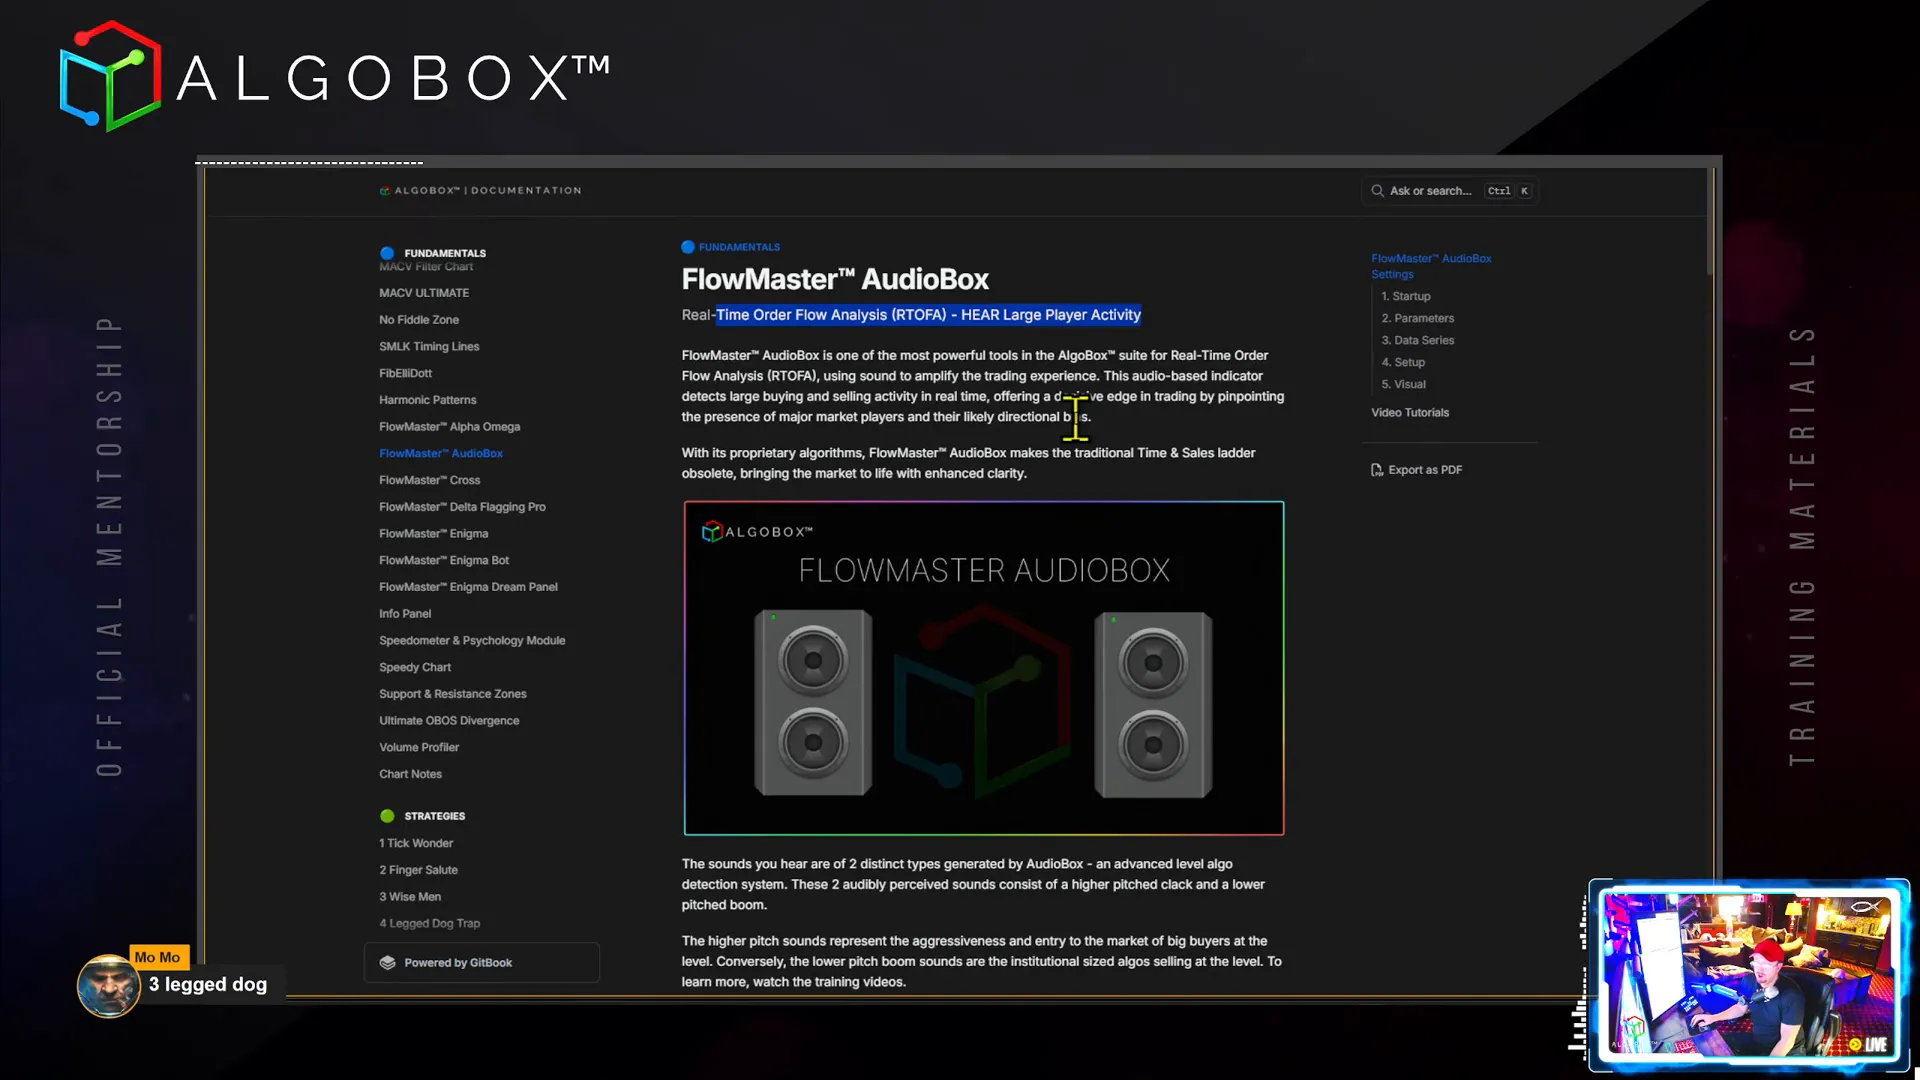
Step 16: Flowmaster AudioBox – Trading with Sound
The Flowmaster AudioBox is one of AlgoBox’s standout features, bringing real-time order flow to life through audio cues. It generates two distinct sounds:
- A higher-pitched “clack” indicating aggressive buying by large players.
- A lower-pitched “boom” signaling institutional-sized selling.
This audio feedback allows traders to sense market moves without staring at the screen constantly, adding an emotional and intuitive layer to trading. The sounds can be customized, and a test button helps ensure proper setup.
Vinny shares that AudioBox can even alert him when he’s away from the desk, prompting timely market checks.
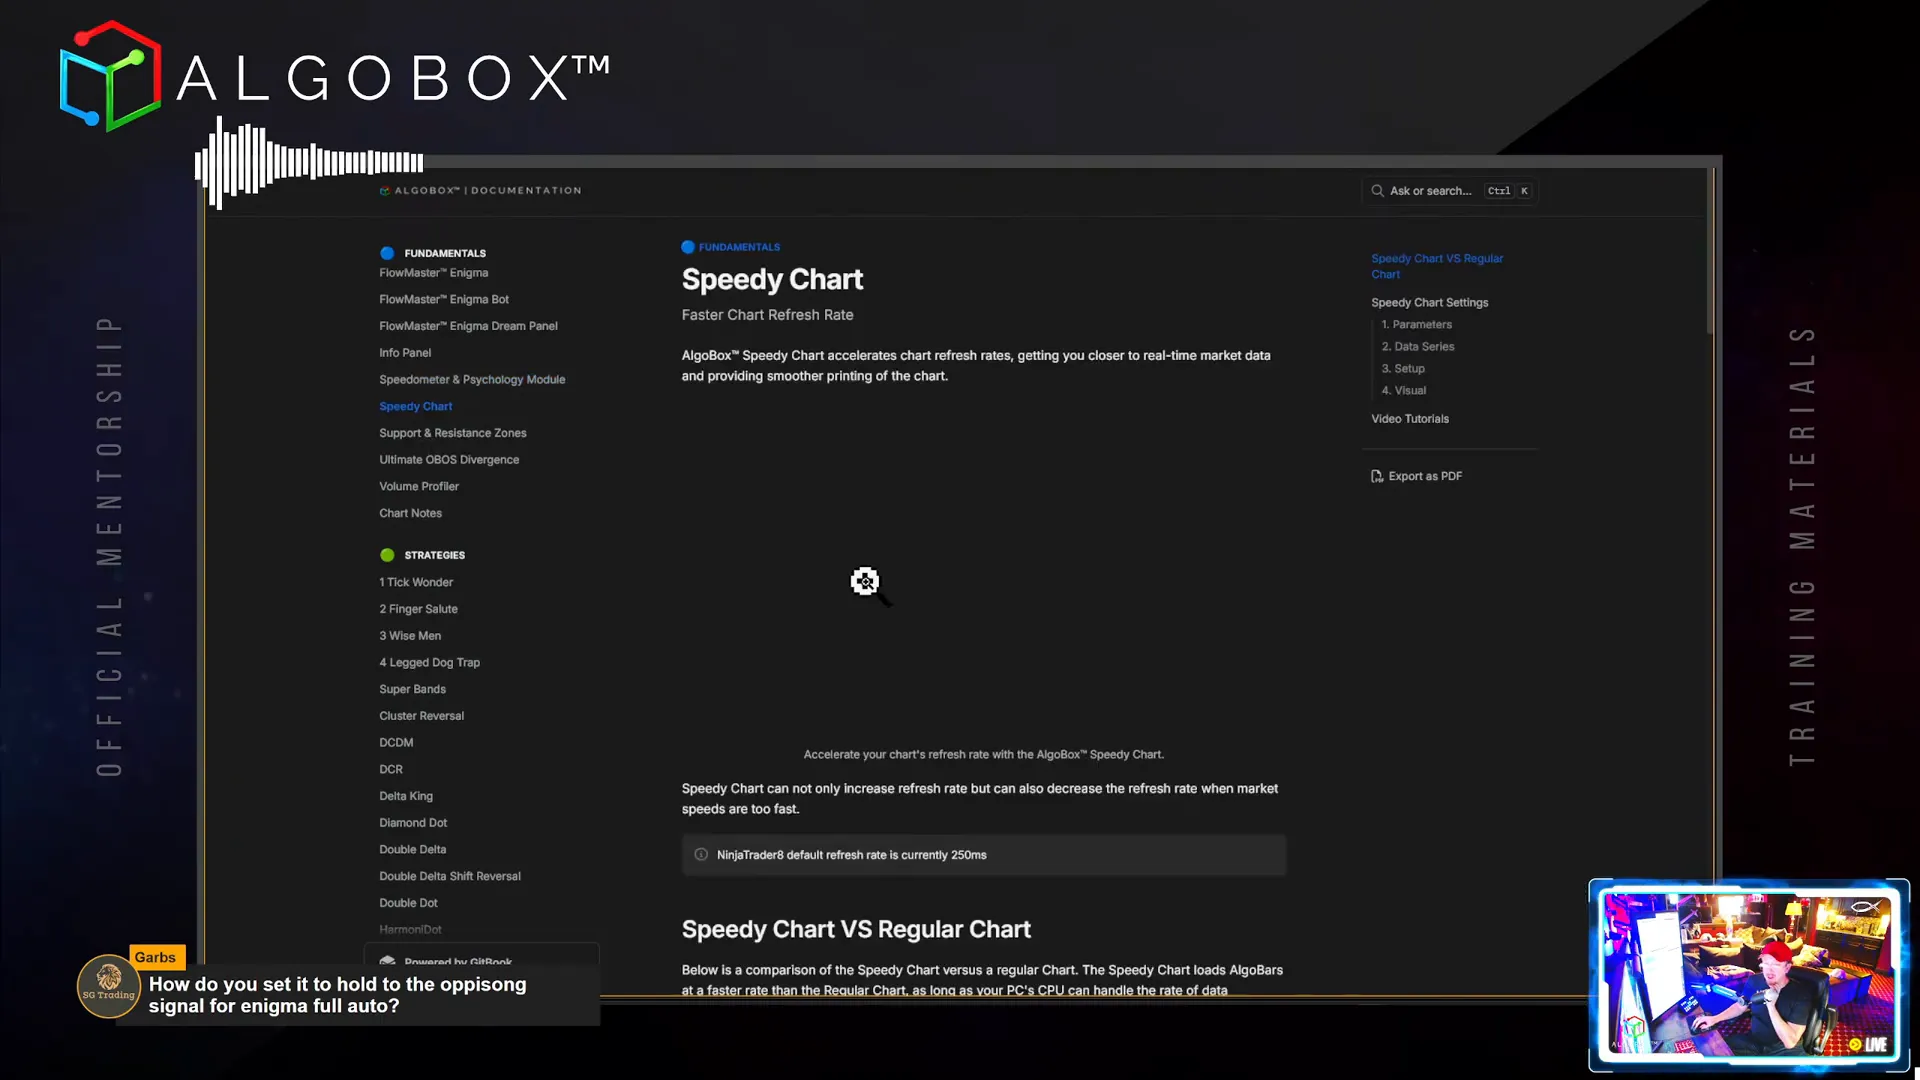
Step 17: Speedy Chart – Optimizing Chart Refresh Rates
The Speedy Chart feature enhances NinjaTrader’s default refresh rate, offering smoother and more responsive chart updates. By default, NinjaTrader refreshes every 250 milliseconds, which can be laggy during fast markets.
Speedy Chart allows you to adjust the refresh rate dynamically based on market speed, slowing down updates during extremely volatile periods to reduce system strain and speeding up during calmer markets for better granularity.
Settings include refresh rate thresholds and delay times, enabling customization to your hardware capabilities and trading style.
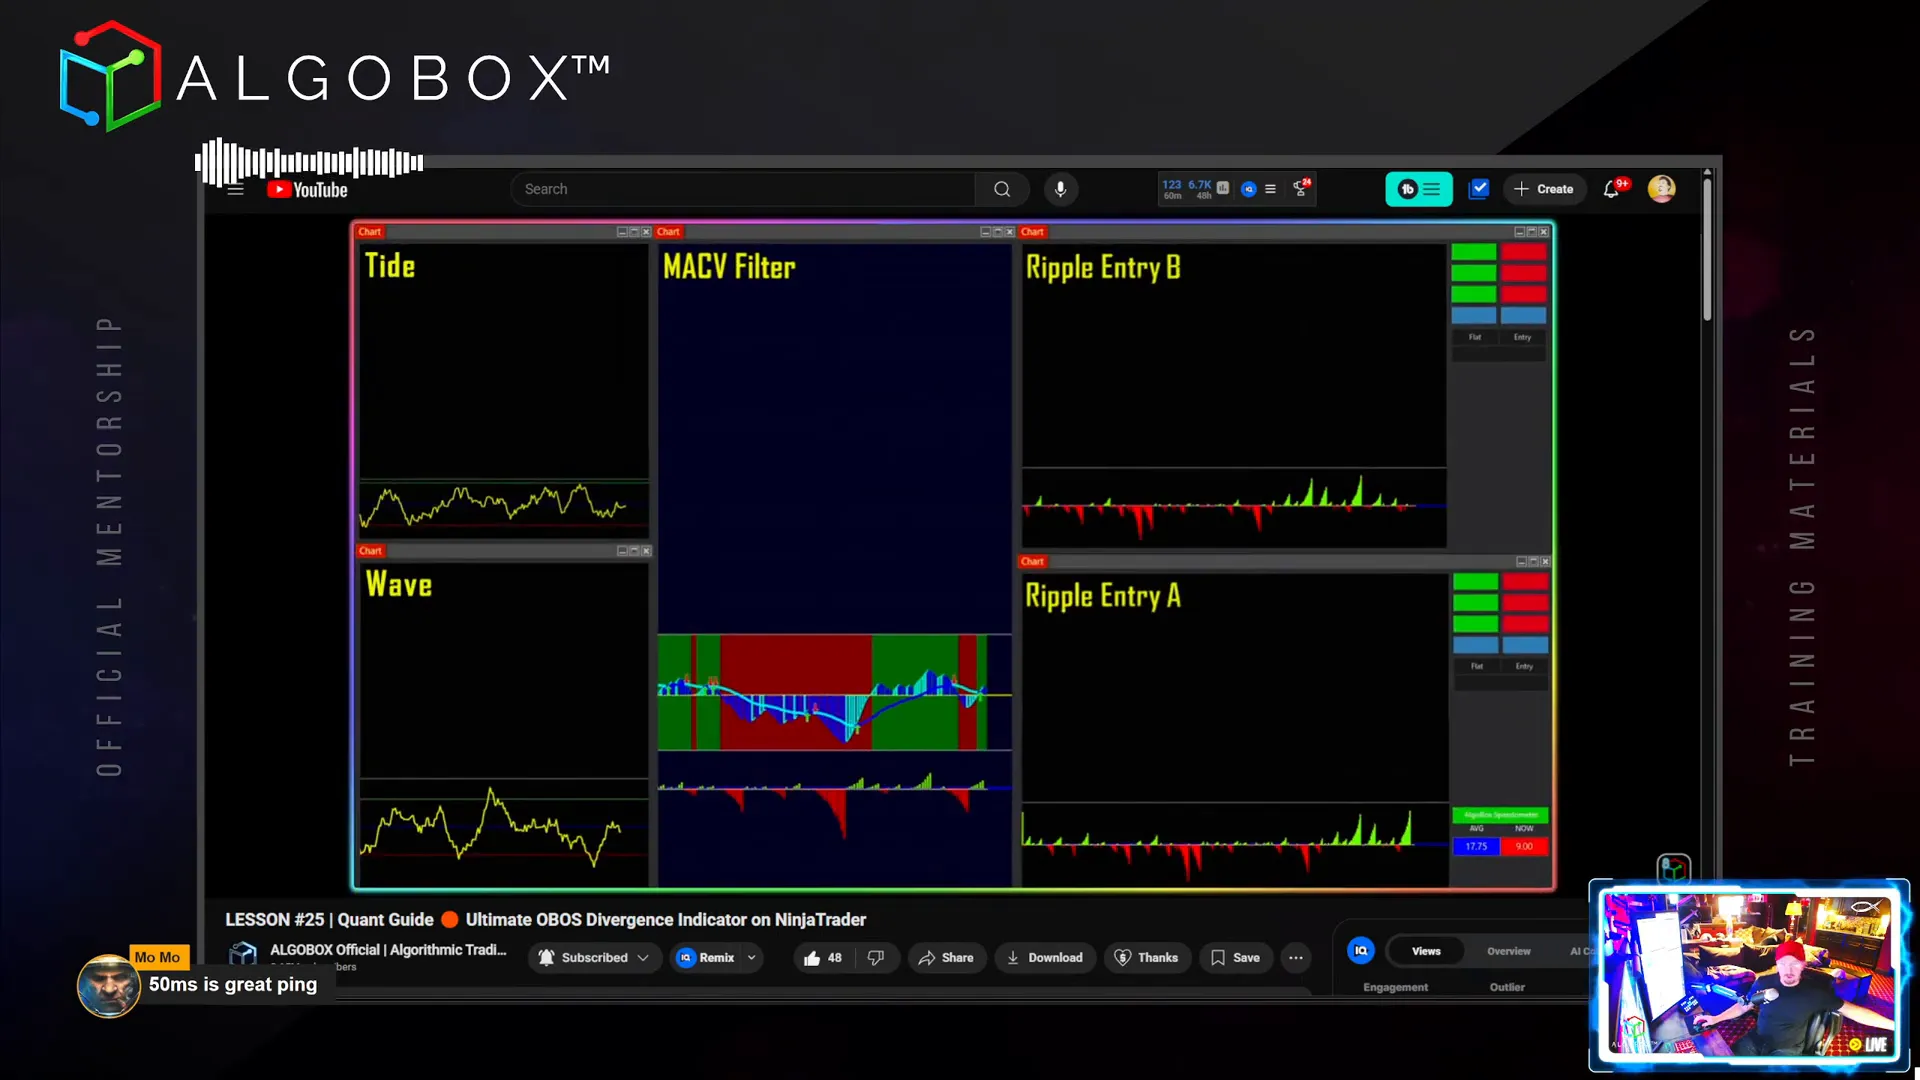
Step 18: Ultimate OBOS Divergence Indicator
The Ultimate Overbought/Oversold (OBOS) Divergence Indicator is designed for higher timeframes like the tide, wave, and MACV charts. It detects divergences between price and the oscillator, signaling potential reversals.
It plots purple triangles on the chart when divergence occurs, providing a clear visual cue without requiring traders to monitor the oscillator panel constantly.
This tool is a powerful directional filter but not an entry strategy by itself. It complements other indicators within AlgoBox for enhanced trade decision-making.
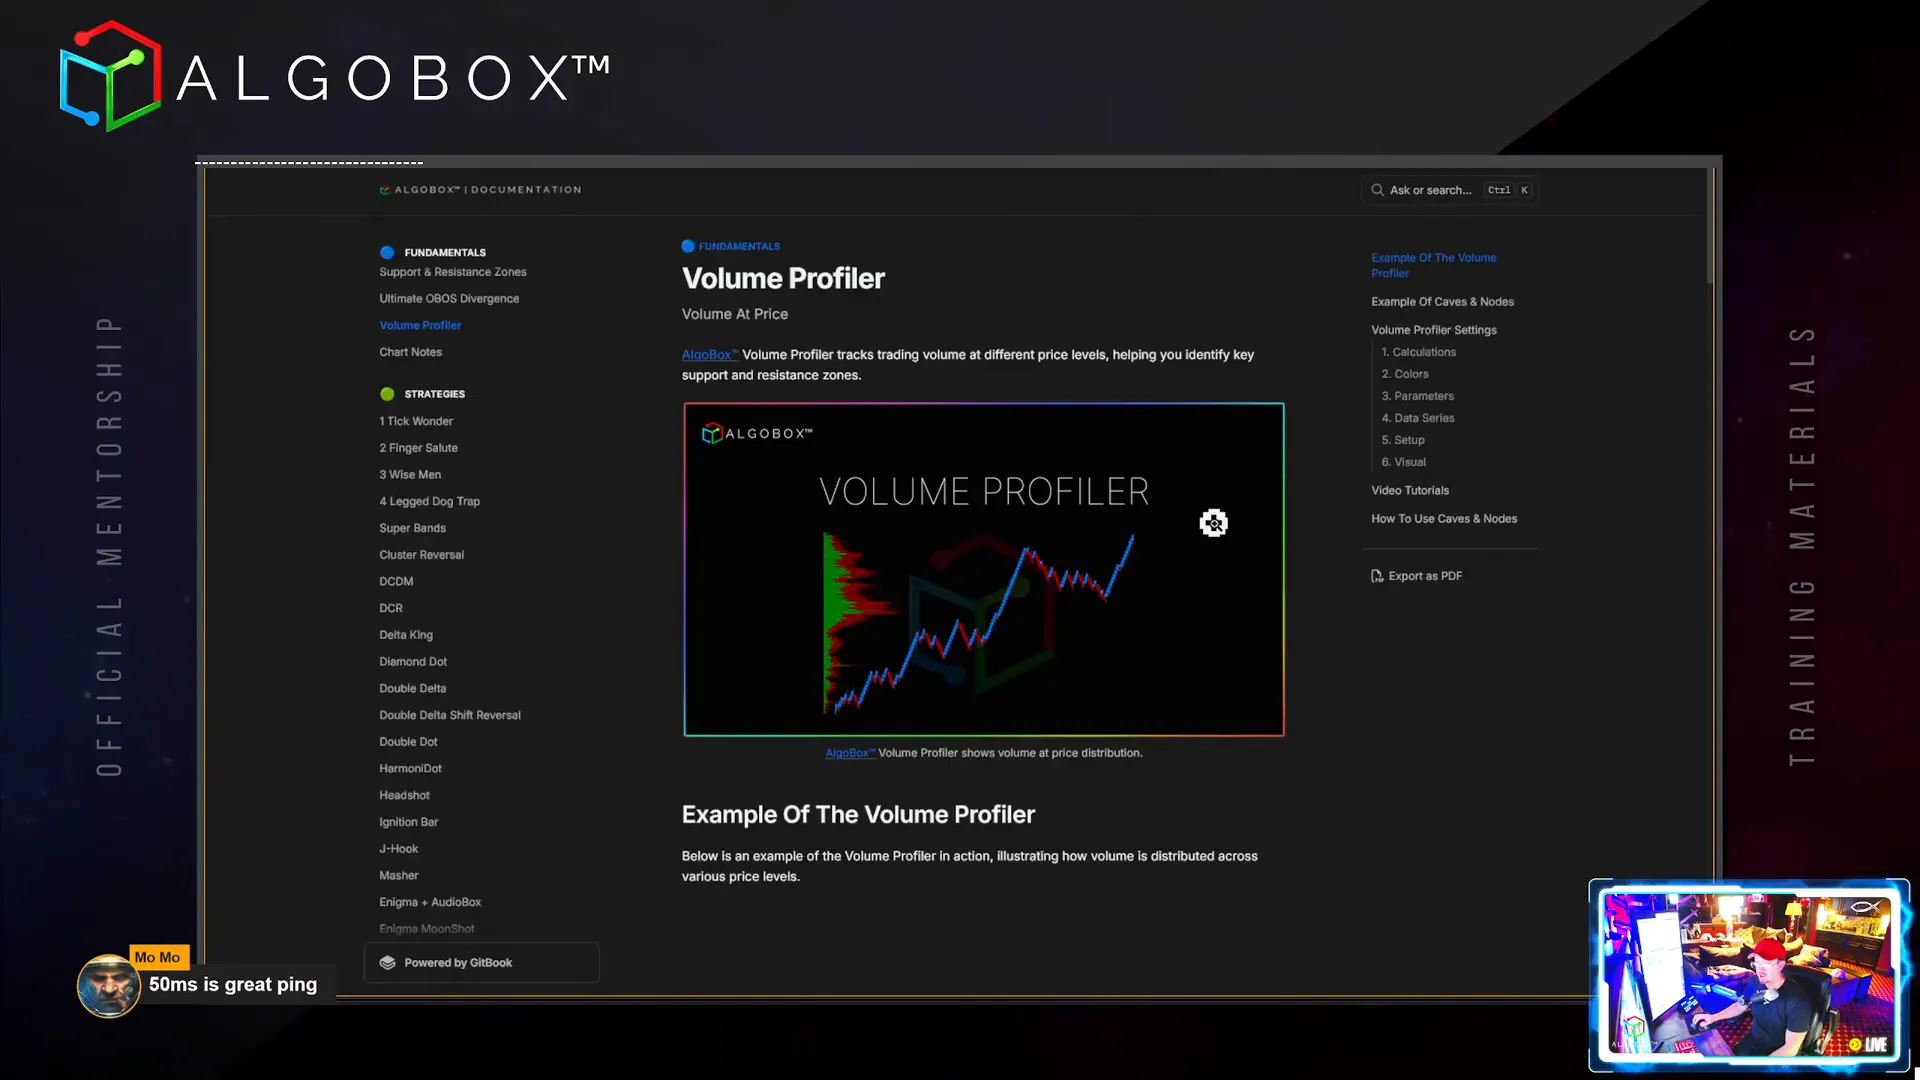
Step 19: Volume Profiler – Identifying Caves and Nodes
The built-in Volume Profiler tracks trading volume at price levels, helping you spot key support and resistance zones. Vinny focuses on two critical features:
- Caves: Areas with low volume indicating potential support or resistance where price can “hide” or reverse.
- Nodes: High-volume clusters often serving as target zones.
Vinny often enters trades near caves and uses nodes as profit targets, combining volume information with other structural and order flow signals.
Step 20: Chart Notes – Keeping Your Trading Disciplined
AlgoBox includes a simple Chart Notes indicator allowing you to keep important reminders and trading rules visible on your charts. You can customize the text, font size, and position to suit your workflow.
This tool is especially beneficial for beginners or traders working on discipline, helping reinforce positive habits and avoid emotional mistakes.
Conclusion: Mastering AlgoBox Fundamentals for Better Trading
Mastering the fundamentals of AlgoBox, as outlined in this guide, sets the stage for profitable and disciplined futures trading. From understanding the Order of Operations to leveraging advanced order flow tools like the Flowmaster suite and Enigma indicators, every component plays a vital role in your trading success.
Automation tools like the Enigma Dream Panel and AudioBox enhance your ability to react swiftly and accurately to market conditions, while psychological aids like the Speedometer keep you disciplined.
Remember, trading is a journey of continuous learning and adaptation. Use these tools wisely, practice diligently, and always manage risk carefully.
For those ready to take the next step, deep dive into strategy development and execution techniques will unlock even greater potential. Stay focused, stay disciplined, and happy trading!
Ready to learn more? Join the AlgoBox Academy and access full training, quizzes, and live sessions to accelerate your trading journey.