I created this guide to walk you step-by-step through the SUPERMOON strategy I teach inside the AlgoBox system. As the author of the original training content produced for ALGOBOX PRO | Automated Trading, my goal is to give you a clear, practical roadmap to recognize high-confluence order flow setups using two core components: the Flowmaster Enigma and the Double Delta (Ready DD) signal. In this article I’ll explain the mechanics behind each component, show you how to read them together, and give detailed trade execution, risk management, and practice advice so you can apply the strategy in real-time and in market replay.
This write-up expands on a short demonstration I recorded and provides additional instruction, examples, and workflow recommendations. I’ll keep the language practical and focused so you can go directly from reading to practicing. If you’re already using NinjaTrader and AlgoBox indicators, this will help you deepen your understanding. If you are new to order flow, it will give you a structured way to begin learning and testing the SUPERMOON concept.
Table of Contents
- Step 1: Understand the two core components
- Step 2: What the Double Delta (Ready DD) signal tells you
- Step 3: Read the Flowmaster Enigma
- Step 4: Define the Supermoon — confluence of signals
- Step 5: Trade execution — entries, targets, and stops
- Step 6: Risk management and position sizing
- Step 7: Practice in a simulated environment (NinjaTrader Market Replay)
- Step 8: Workflow integration with AlgoBox tools and bootcamp
- Step 9: Example walkthrough — a bearish Supermoon setup
- Step 10: Advanced tips, common pitfalls, and troubleshooting
- Conclusion and next steps
Step 1: Understand the two core components
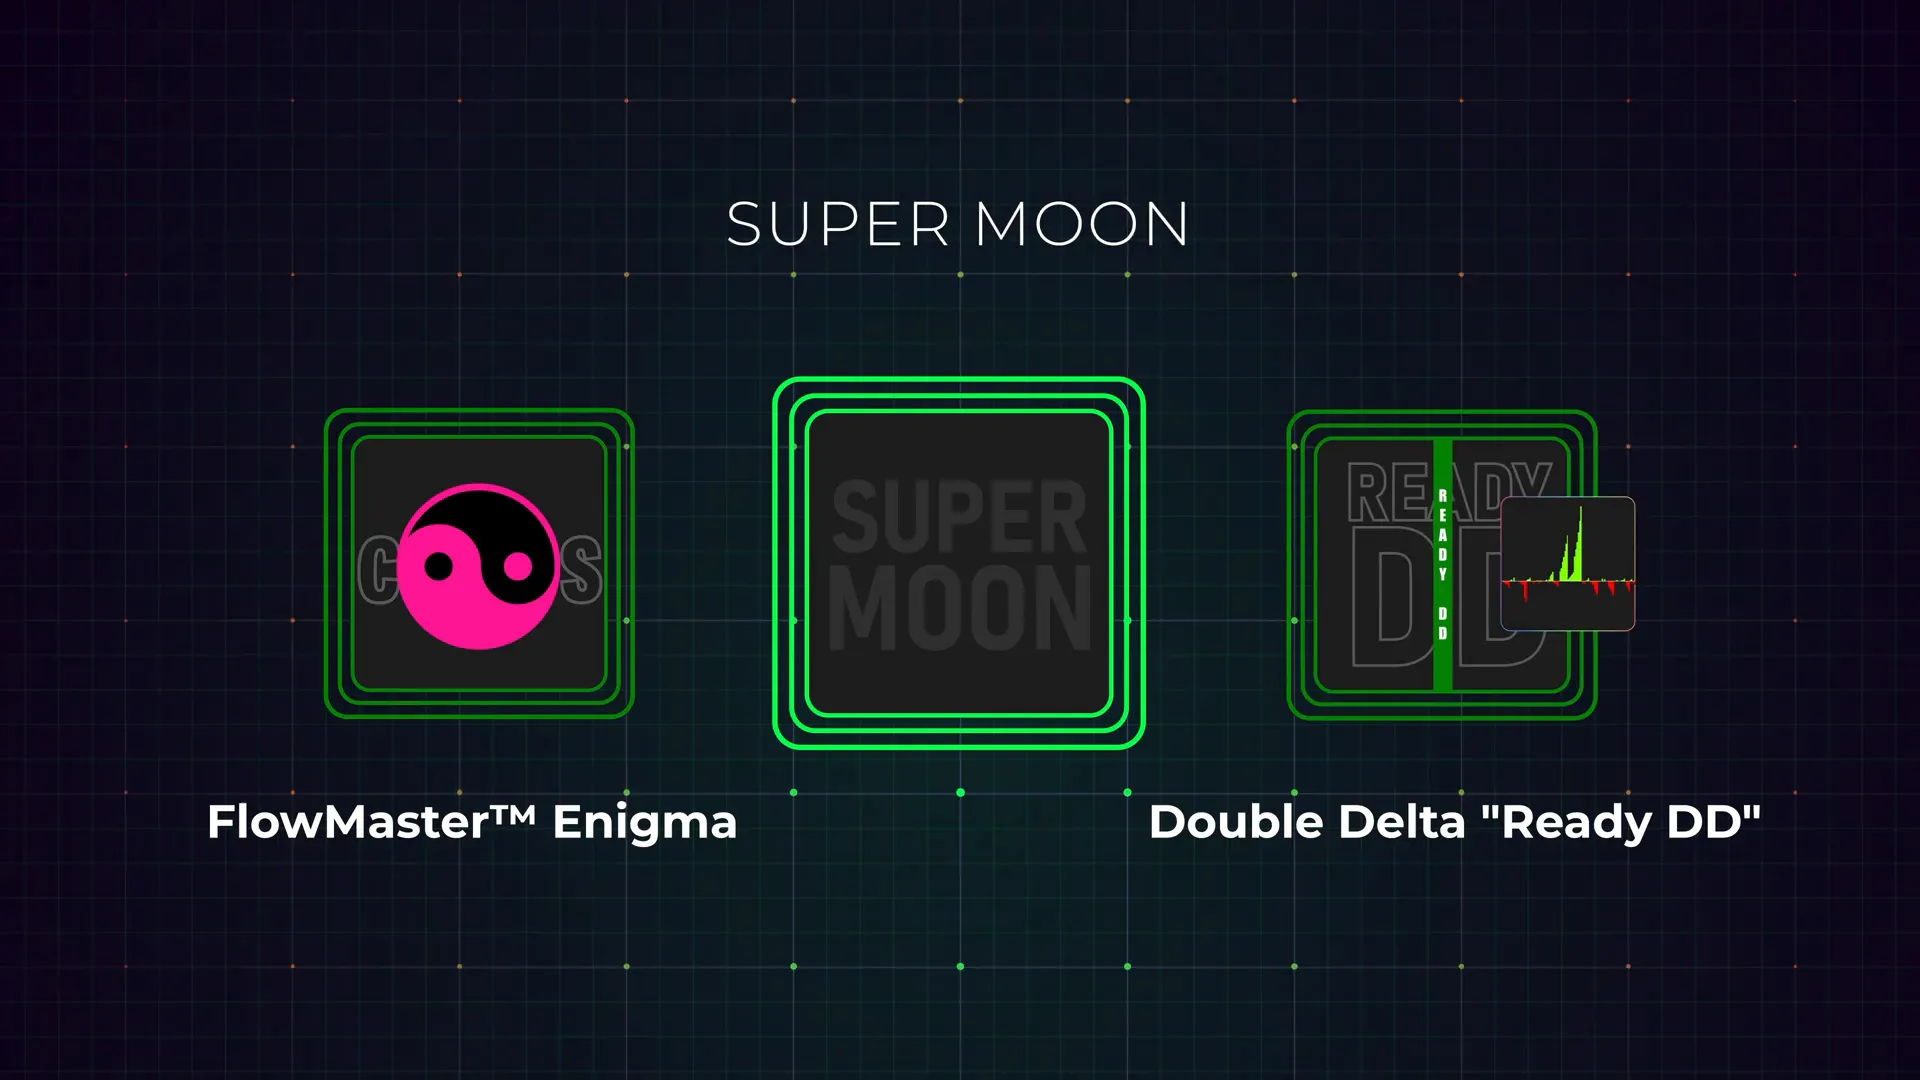
The SUPERMOON strategy relies on two distinct but complementary order flow tools. I use both in tandem to create what I call high-confluence setups — points where multiple signals suggest a likely short-term directional move. The two components are:
- Flowmaster Enigma — an order flow-based model that highlights market imbalances and likely exhaustion or directional shifts. It displays color-coded markers and an estimated target line to help visualize where the order flow imbalance might resolve.
- Double Delta (Ready DD) signal — a vertical text label that appears when two delta base flags converge, suggesting a potential shift in momentum. The label is colored (commonly red for bearish, blue/green for bullish) and its appearance near key price levels adds weight to a potential directional move.
To make the SUPERMOON approach work consistently, you need to understand each component separately before combining them. Think of the Ready DD as a short-term momentum “nudge” and the Enigma as a contextual order flow map that shows where the push might meet real resistance or exhaustion.
Step 2: What the Double Delta (Ready DD) signal tells you
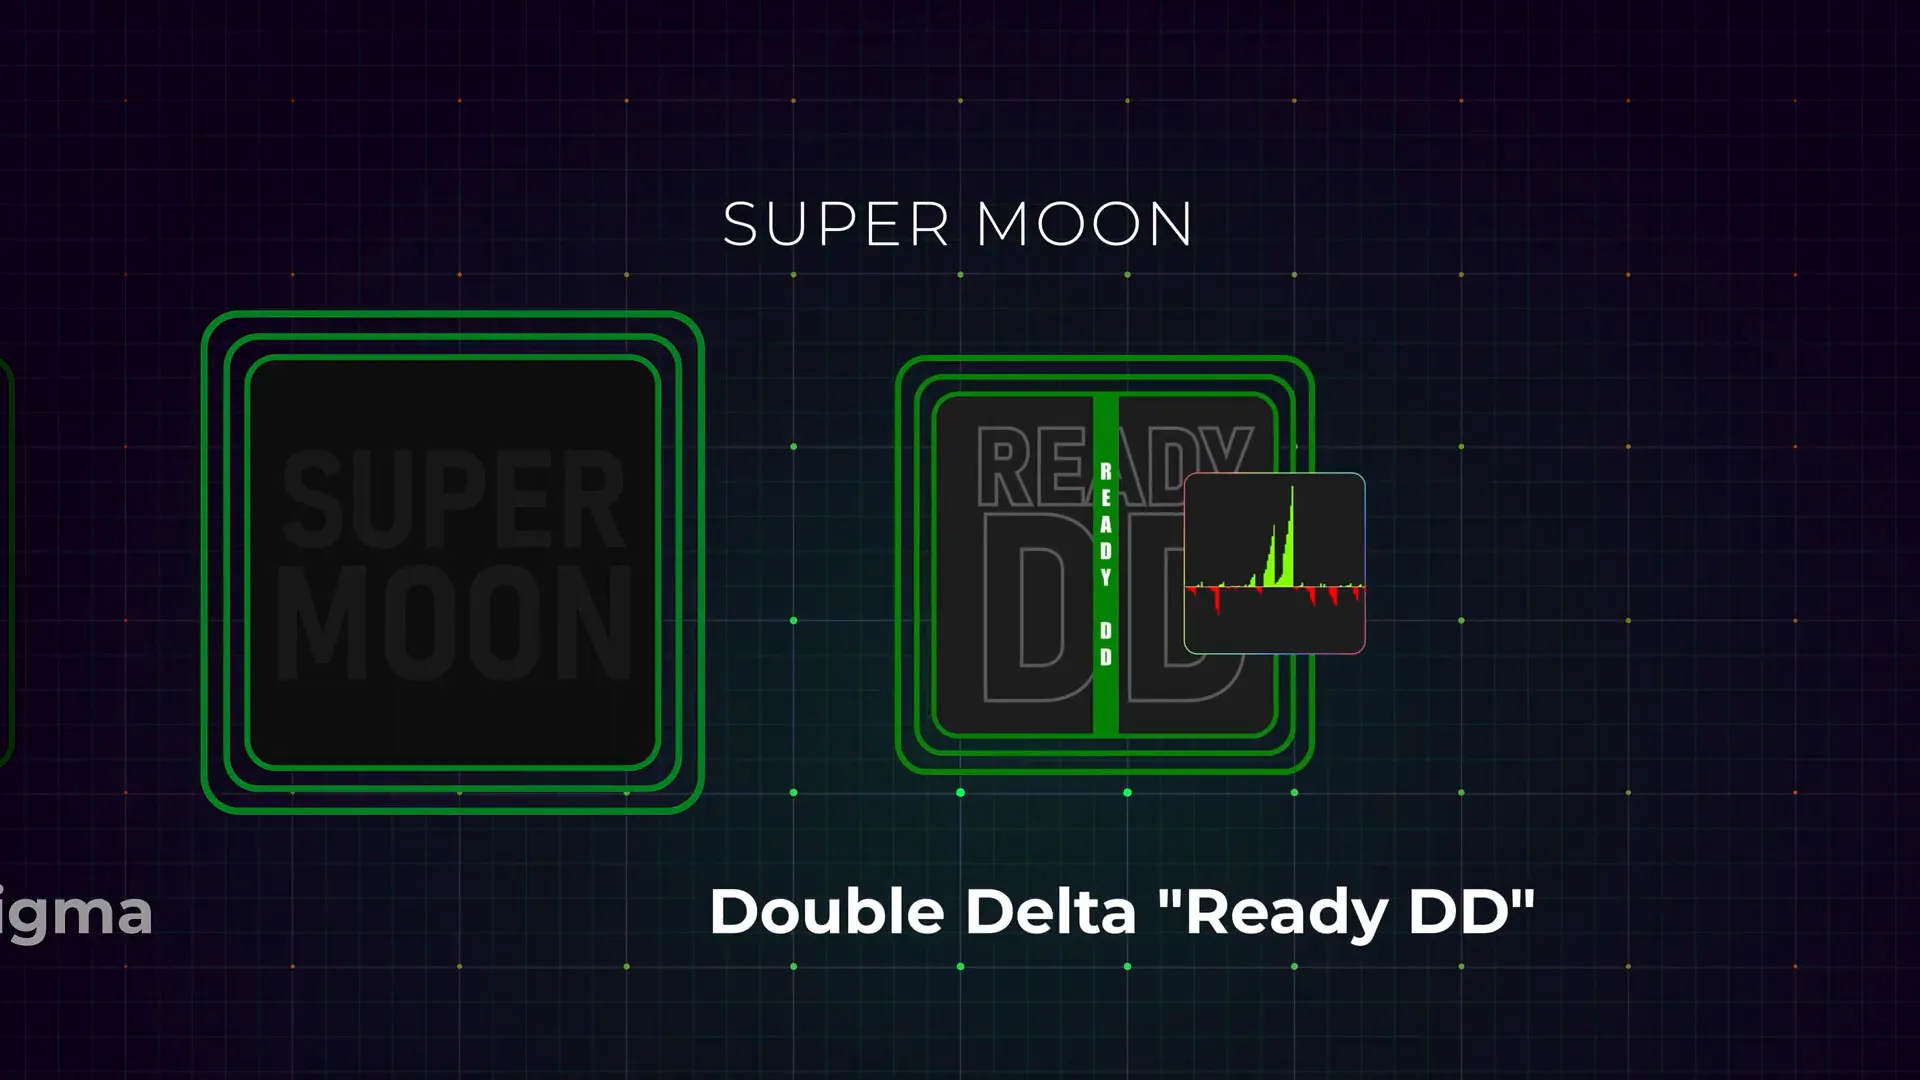
The Double Delta ready DD signal is a discrete event indicator. It appears as a vertical label on your chart when two delta base flags converge. Convergence means that discrete blocks of buying or selling delta — measurable by executed market orders vs. passive limit orders — align in a way that suggests an increase in aggressive volume on one side of the market.
Here are the characteristics I pay attention to when the Ready DD label appears:
- Color: Typically red indicates bearish aggressive selling; blue or green indicates bullish aggressive buying.
- Location relative to price structure: A Ready DD that appears at a swing high, resistance area, or near a structural level (mid-day range extremes, session high/low, S/R zones) carries more trading value.
- Frequency: A single Ready DD is information; repeated or clustered Ready DDs are stronger signals of a sustained momentum shift.
- Context: The market environment matters. A Ready DD within a trending context can signal continuation, while the same label in an exhaustion zone can suggest a reversal or correction.
“The double delta ready d d signal appears as a vertical text label when two delta base flags converge, signaling a potential shift in market momentum.”
When I see a Ready DD near a confluence area (moving average clusters, order flow imbalance region, previous high/low), I prepare for a possible short-term trade entry depending on what additional order flow context the Flowmaster Enigma provides.
Step 3: Read the Flowmaster Enigma
The Flowmaster Enigma is my go-to visualization for live order flow. It’s designed to show where buying or selling is dominant, and where that dominance might be weakening. The Enigma displays color-coded markers and an estimated target line, helping you visualize both the direction and the potential resolution point of the imbalance.
Key Enigma features I use:
- Color Markers — Blue and green indicate bullish momentum or buying pressure. Pink and red indicate bearish momentum or selling pressure. The color intensity often reflects the degree of imbalance or exhaustion.
- Estimated Target Line — A projection generated from the detected order flow imbalance showing where the price might go if the imbalance resolves in favor of the detected direction.
- Exhaustion Markers — When the Enigma shows signs of exhaustion (changing color intensity, smaller imbalance size), I treat that as a caution or a potential reversal point.
- Real-Time Analysis — The Enigma works live, so you can see imbalances as they develop, rather than waiting for post-hoc confirmation.
“The Flowmaster enigma uses real time order flow analysis to highlight market imbalances, signaling potential exhaustion or directional shifts with color coded markers.”
I treat the Enigma as the situational map: it tells me where the market’s active liquidity imbalances are, where sellers are dominating, and where buyers are overwhelming sellers. It also produces the visual cues I use for entries, stops, and targets.
Step 4: Define the Supermoon — confluence of signals
The SUPERMOON is what happens when the Ready DD and the Flowmaster Enigma align in space and time. The concept is simple: when a momentum nudge (Ready DD) appears near a significant order flow imbalance (Enigma marker), you get a higher probability opportunity than you would from either signal alone.
When I call a setup a Supermoon it typically includes:
- A Ready DD label that indicates a directional shift.
- An Enigma color marker that aligns with the Ready DD (pink/red for bearish or blue/green for bullish) appearing within the same price zone or a few bars after.
- Price action that respects a nearby technical level — e.g., failure at a resistance, rejection at a session high, or rejection from an order flow imbalance zone.
- Reasonable risk-reward using the Enigma estimated target and stop placement behind the Enigma marker.
When these elements stack, I treat the setup as a higher-confluence trade. In the demonstration example I recorded, this looked like a red Ready DD label followed within a few bars by a pink Enigma marker in the same zone — a textbook bearish Supermoon sequence.
Step 5: Trade execution — entries, targets, and stops
Now we get to the practical part: how to actually trade a Supermoon setup. I’m going to break execution into entry selection, target planning, stop placement, and position sizing. Trading is always about probabilities and risk control — I never trade without a plan for every leg.
Entry
When the Enigma confirms the Ready DD direction, I prefer to enter as close as possible to the Enigma signal. There are three common entry techniques I use depending on my confidence and the market context:
- Immediate entry — Enter market or aggressive limit within one tick of the Enigma marker when I’m confident the sequence is valid and liquidity is present.
- Pullback entry — Wait for a retracement back toward the Enigma marker or a structural level (like a VWAP, moving average, or previous high/low), then enter with a limit order.
- Confirmation entry — Wait for a short bar or cluster that confirms continued order flow in the Enigma direction (e.g., additional bearish delta prints after a red DD and pink Enigma) before entering.
I choose the entry style based on the strength of the signal and my trade plan. Aggressive entries can produce higher slippage but allow for tighter stops. Conservative entries reduce slippage but may miss some moves.
Targets
The Enigma gives an estimated target line which I use as my primary reference for profit taking. I combine that with conventional price structure targets:
- Primary target: the Enigma estimated target line.
- Secondary target: the next structural level (previous day’s low/high or a measured move level).
- Scale-out approach: take partial profits at the Enigma target and trail stops for the remainder to capture extended moves.
Using the Enigma target helps me quantify the expected move based on order flow imbalance rather than arbitrary tick goals. I always confirm that the target aligns with a sensible risk-reward ratio before taking the trade.
Stop placement
Stop placement is crucial. My default approach is to place stops behind the Enigma marker or behind a nearby structural level that invalidates the order flow picture. Specific methods:
- Behind the Enigma — A stop placed a few ticks beyond the Enigma marker, accounting for volatility and typical spread.
- Structure-based stop — A stop behind a notable swing high/low or beyond a session high/low if the Enigma sits within that structure.
- Volatility-adjusted stop — Use an ATR-based buffer to avoid being stopped by normal noise.
Whatever method I use, I make sure the stop is meaningful and that I won’t let emotion widen it mid-trade without a clear reason. I also size my position so that the dollar risk at my stop matches my risk plan.
Step 6: Risk management and position sizing
Risk management is the backbone of consistent trading. The SUPERMOON strategy gives signals, but your edge comes from disciplined risk control and position sizing. Here’s how I approach it.
Calculate dollar risk first
I always calculate the dollar amount I’m risking on a trade before submitting an order. That means:
- Deciding my max acceptable loss per trade (e.g., 0.5% of account equity).
- Determining distance in ticks between entry and stop.
- Converting ticks to dollar value to calculate position size.
Example: If I risk $200 on a trade and my stop is 10 ticks away, I size the contract quantity so that a 10-tick loss equals $200. That keeps my account risk consistent across diverse market conditions.
Use scaling and partial exits
I prefer to scale out of positions when possible. If the Enigma estimated target is modest, I might take 50% at target and trail the remaining 50% with a breakeven stop. Scaling reduces the emotional impact of single-exit decisions and allows me to capture additional reward if the move extends beyond the initial projection.
Daily drawdown limits
I also adhere to daily drawdown limits. If I hit my predefined daily loss threshold, I stop trading for the day. This prevents revenge trading and ensures I preserve capital to trade another day.
Step 7: Practice in a simulated environment (NinjaTrader Market Replay)
Mastering order flow and the SUPERMOON sequence requires repeated practice. I recommend practicing in a simulated environment first, and my platform of choice for that is NinjaTrader with market replay. Here’s a workflow I use for practice sessions:
- Load the desired market and a historical day into Market Replay.
- Apply the Flowmaster Enigma and Ready DD indicator in real-time mode so you can watch signals develop bar-by-bar.
- Start at normal speed and identify every Ready DD appearance and its subsequent Enigma behavior.
- Document setups that meet your Supermoon criteria: time, price level, context, entry method, and outcome.
- Replay the best setups at reduced speed to practice entries and stop placement.
- Keep a trading journal with screenshots and notes about why you took or skipped trades.
Market Replay allows you to pause, rewind, and step forward to precisely analyze how the Ready DD and Enigma interact. This is where you build your pattern recognition and timing skills without risking real capital.
Step 8: Workflow integration with AlgoBox tools and bootcamp
AlgoBox provides a suite of tools that integrate the Ready DD and Flowmaster Enigma into a single platform workflow. If you’re using AlgoBox, I recommend the following learning path:
- Start with the free download and install the indicators in your NinjaTrader environment.
- Complete an 8-video bootcamp that walks you through indicator settings, chart layouts, and practical trade examples.
- Use the two-week free trial to run the tools in Market Replay and in a simulated environment to validate the signals under different market regimes.
- Join live sessions and the AlgoBox traderoom to watch and discuss real-time setups with other traders. This social proof and group feedback accelerate learning.
The bootcamp and live sessions help you move from recognizing signals to executing and managing trades consistently. I designed the curriculum to cover both the technical setup of the tools and the trader mindset required to apply them under pressure.
Step 9: Example walkthrough — a bearish Supermoon setup
Let’s walk through the exact sequence I demonstrated. I’ll reconstruct it logically so you can follow the decision-making process step-by-step.
- Ready DD appears (red) — The chart shows a red Ready DD label that signals a potential bearish momentum shift. This is my initial alert to pay attention.
- Context check — I immediately check whether this Ready DD is at a structural resistance, a session high, or coincides with a prior supply zone. In the demo, the label appeared near a price zone where sellers had previously shown strength.
- Flowmaster Enigma confirmation (pink) — Within a few bars the Flowmaster Enigma produced a pink marker in essentially the same price zone. Pink indicates bearish selling pressure that corroborates the Ready DD signal.
- Entry decision — Given the matching color and close time proximity, I adopt a short bias. My preferred entry is as close to the Enigma marker as possible, often with an aggressive limit order slightly below a micro-support level to get filled quickly on the move.
- Stop placement — I place the stop a few ticks above the Enigma marker or behind a nearby swing high. The stop is sized so my dollar risk does not exceed my pre-determined limit.
- Target planning — I reference the Enigma’s estimated target line as my primary profit-taking point. Depending on my risk-reward, I might scale out partial position at that target and trail the remainder to lock in profits.
- Trade management — If the price moves in my favor, I monitor additional order flow prints. Continued bearish delta prints strengthen the case to hold; any significant bullish delta absorption near my target is a signal to tighten stops or exit.
“A red ready d d label appears, suggesting potential bearish momentum. Within a few bars, a pink enigma forms in the same zone, reinforcing the possibility of seller strength.”
This simple sequence is powerful because it uses both a momentum nudge (Ready DD) and an order flow imbalance map (Enigma). The combination gives me a clear entry bias, a meaningful stop location, and a data-driven target.
Step 10: Advanced tips, common pitfalls, and troubleshooting
Once you become comfortable with basic Supermoon setups, there are advanced considerations that help you refine edge and avoid common mistakes.
Advanced tips
- Time of day matters — Order flow behaves differently during open, lunch, and close. Supermoon setups during high liquidity periods (open and close) tend to have clearer order flow and quicker resolution. Midday setups may require more caution and wider stops due to lower liquidity.
- Combine with context indicators — Use higher timeframe order flow, session profile, and volume nodes to strengthen your bias. A Supermoon at a Point of Control (POC) or session value boundary is more meaningful.
- Watch for hidden absorption — Sometimes large players show absorption that hides behind superficial order flow. Look for repeated delta divergences and cumulative delta behavior to catch these moves.
- Keep a journal focused on signal behavior — Log not just results, but the exact sequence of delta prints. Over time you’ll learn which micro-patterns within the Enigma+Ready DD sequence are most reliable.
Common pitfalls
- Blindly following single signals — A lone Ready DD without Enigma confirmation can be noisy. The strategy is about confluence.
- Using fixed stop distances — Markets change; a fixed stop that doesn’t consider volatility often leads to being whipsawed. Adjust stops to the context.
- Overtrading on low-confidence signals — Wait for clean sequences; avoid forcing trades just to be active.
- Neglecting execution quality — Slippage and order routing matter. Use simulated fill models in Market Replay to estimate real execution outcomes.
Troubleshooting indicator behavior
If you see inconsistent Enigma or Ready DD behavior, check these items first:
- Ensure your data feed is complete and not delayed, as order flow requires tick-level precision.
- Confirm indicator settings were not changed; default thresholds for delta convergence and imbalance size can affect signal frequency.
- Inspect the time frame and aggregation used for the indicators — different tick or volume bars will alter the appearance and timing of signals.
- When in doubt, revert to a known historical session that produced clear setups and compare live vs. replay behavior to isolate issues.
Conclusion and next steps
The SUPERMOON strategy is a practical framework that leverages two complementary order flow tools — the Ready DD and the Flowmaster Enigma — to generate higher-confluence trade opportunities. It’s not a silver bullet; rather, it’s a disciplined approach that combines real-time order flow data, structural context, and strict risk management.
My recommended next steps for mastering the approach:
- Install the indicators in a simulated environment like NinjaTrader Market Replay.
- Follow the 8-video AlgoBox bootcamp to understand settings and layouts.
- Practice identifying Ready DD + Enigma sequences and journal every instance.
- Work on execution: practice entries, stop placements, and scale-outs until you can consistently manage trades with discipline.
- Join live sessions or the traderoom to watch real-time setups and compare notes with other traders.
Remember: the edge comes not just from the signals but from consistent risk management and disciplined execution. The Supermoon setup gives you a clear framework — the rest is practice and tradecraft.
If you want to go deeper, I encourage you to take advantage of a free trial of the AlgoBox toolkit and to complete the bootcamp. The combination of tools, replay practice, and group learning accelerates the path from identification to consistent execution. See you in the next live session, and good trading.