
Trading futures successfully requires a deep understanding of market dynamics and the ability to identify key turning points where big players are active. One of the most powerful concepts I use in my trading strategy is the Defense Leg. This technique helps me pinpoint areas where institutional traders, or the “big guys,” have made significant moves and are likely to defend their positions. In this comprehensive guide, I’m going to walk you through the Defense Leg strategy step-by-step, explaining what it is, how to identify it, and how to use it to maximize your day trading profits.
Throughout this post, I’ll share insights from my own experience using the Defense Leg concept with AlgoBox for NinjaTrader, a tool that makes spotting these critical zones much easier. Whether you’re a beginner or an experienced trader, understanding this strategy will elevate your trading approach by aligning you with the moves of the market’s largest participants.
Table of Contents
- Step 1: Recognizing the Formation of a Defense Leg
- Step 2: Confirming the Defense Leg with Delta Volume
- Step 3: Identifying the Pivot Point for Price Projection
- Step 4: Drawing the Take Profit Zone
- Step 5: Understanding Why the Defense Leg Works
- Step 6: Navigating Price Action Within the Defense Leg
- Step 7: Watching for the Opposing 1,000 Contract Move
- Step 8: Aligning with the Big Players for Consistent Profits
- Step 9: Practical Tips for Implementing the Defense Leg Strategy
- Step 10: Tools to Enhance Your Defense Leg Trading
- Conclusion: Mastering the Defense Leg for Smarter Day Trading
Step 1: Recognizing the Formation of a Defense Leg
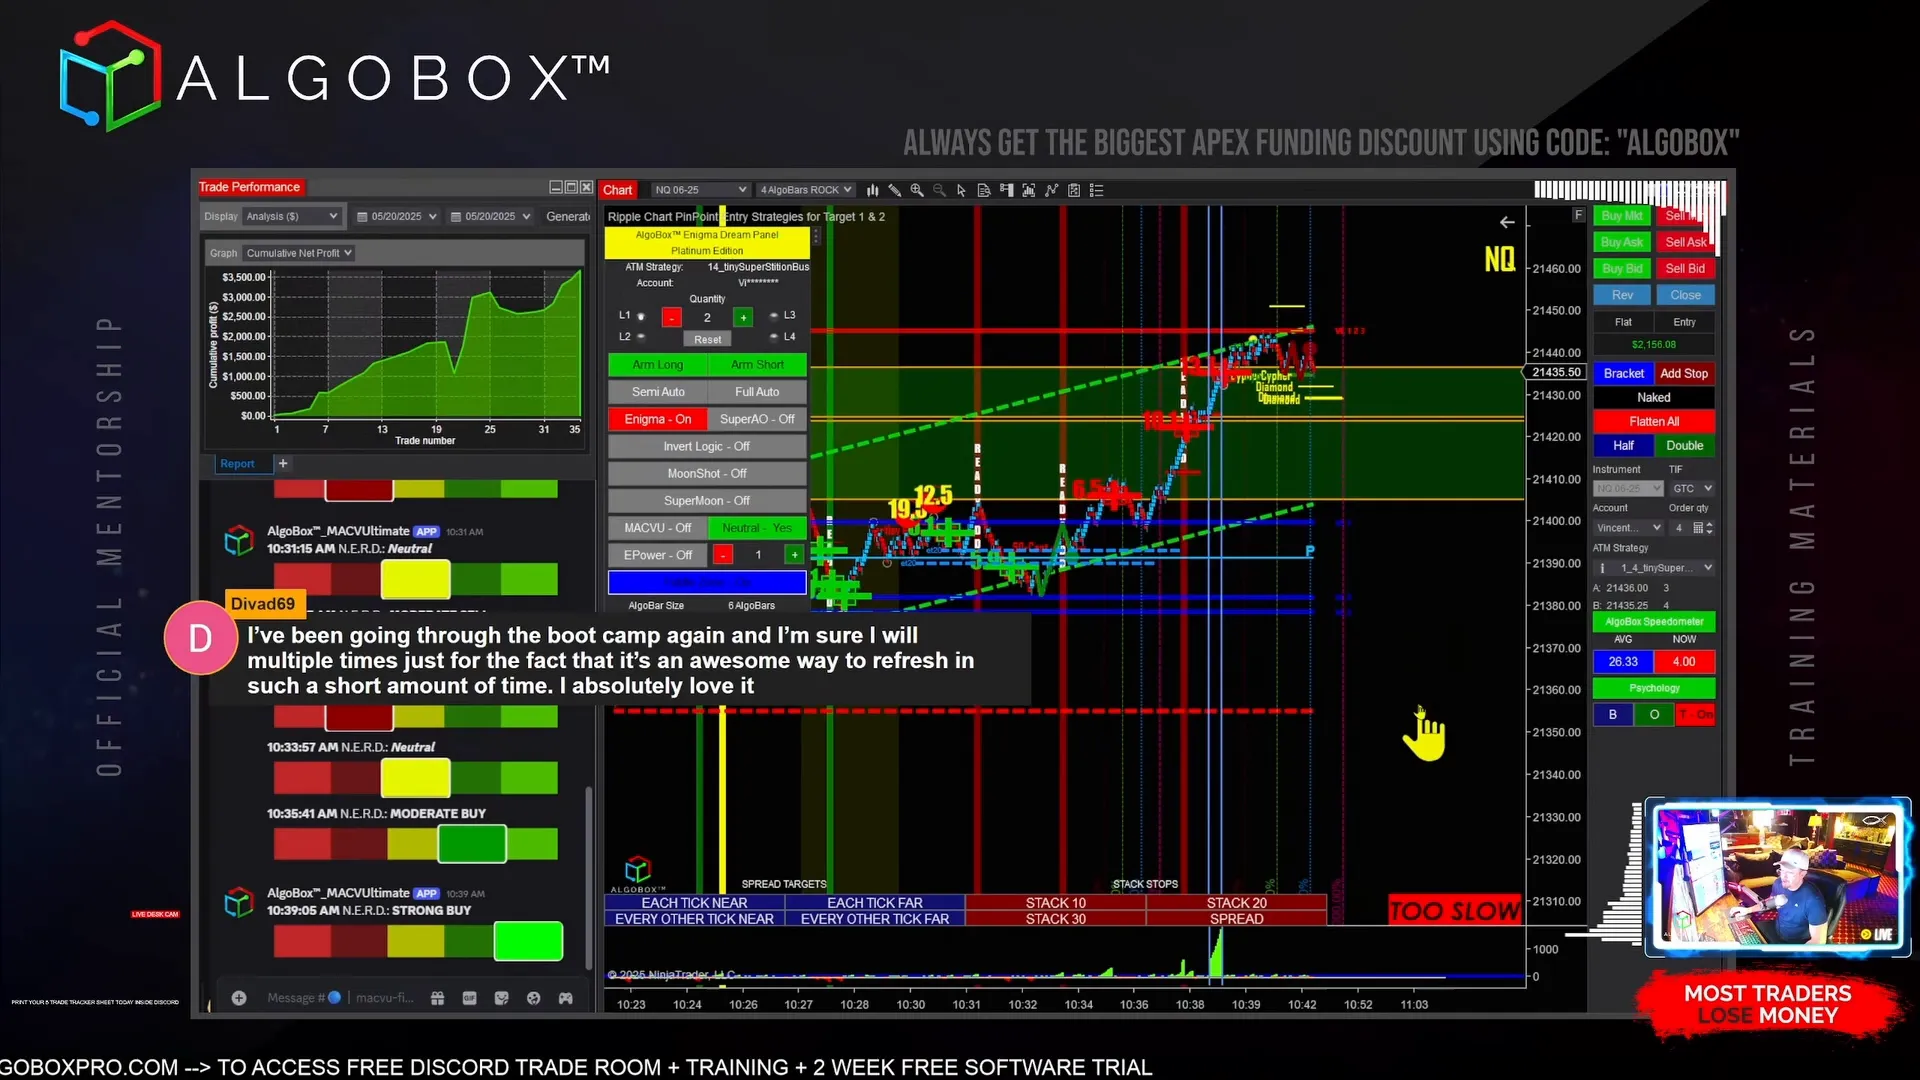
The first and most crucial step is to identify when a Defense Leg has formed. This is a specific price range or zone on the chart where a significant volume spike has occurred, indicating that large traders have entered the market and are prepared to defend their position.
One of the key criteria I look for is a volume spike greater than 1,000 contracts. This threshold is not arbitrary; it represents a substantial commitment by the big players. For example, if I detect a spike around 1,700 contracts, I immediately flag this as a potential Defense Leg. Sometimes, I find more than one defense leg clustered in the same area, which strengthens the significance of that zone.
To keep things clear, I like to keep my chart view shrunk down when these spikes occur. This way, the spikes stand out sharply against the background, making it easier for me to spot double or even multiple defense legs stacked on top of each other in the same price area.
Once I identify such a zone, I mark it clearly on my chart and prepare to trade around it. This area becomes my primary focus for the day, as I expect the market to respect it. I save my workspace frequently to ensure that all my markings and analyses are preserved, even if the platform crashes.
Step 2: Confirming the Defense Leg with Delta Volume
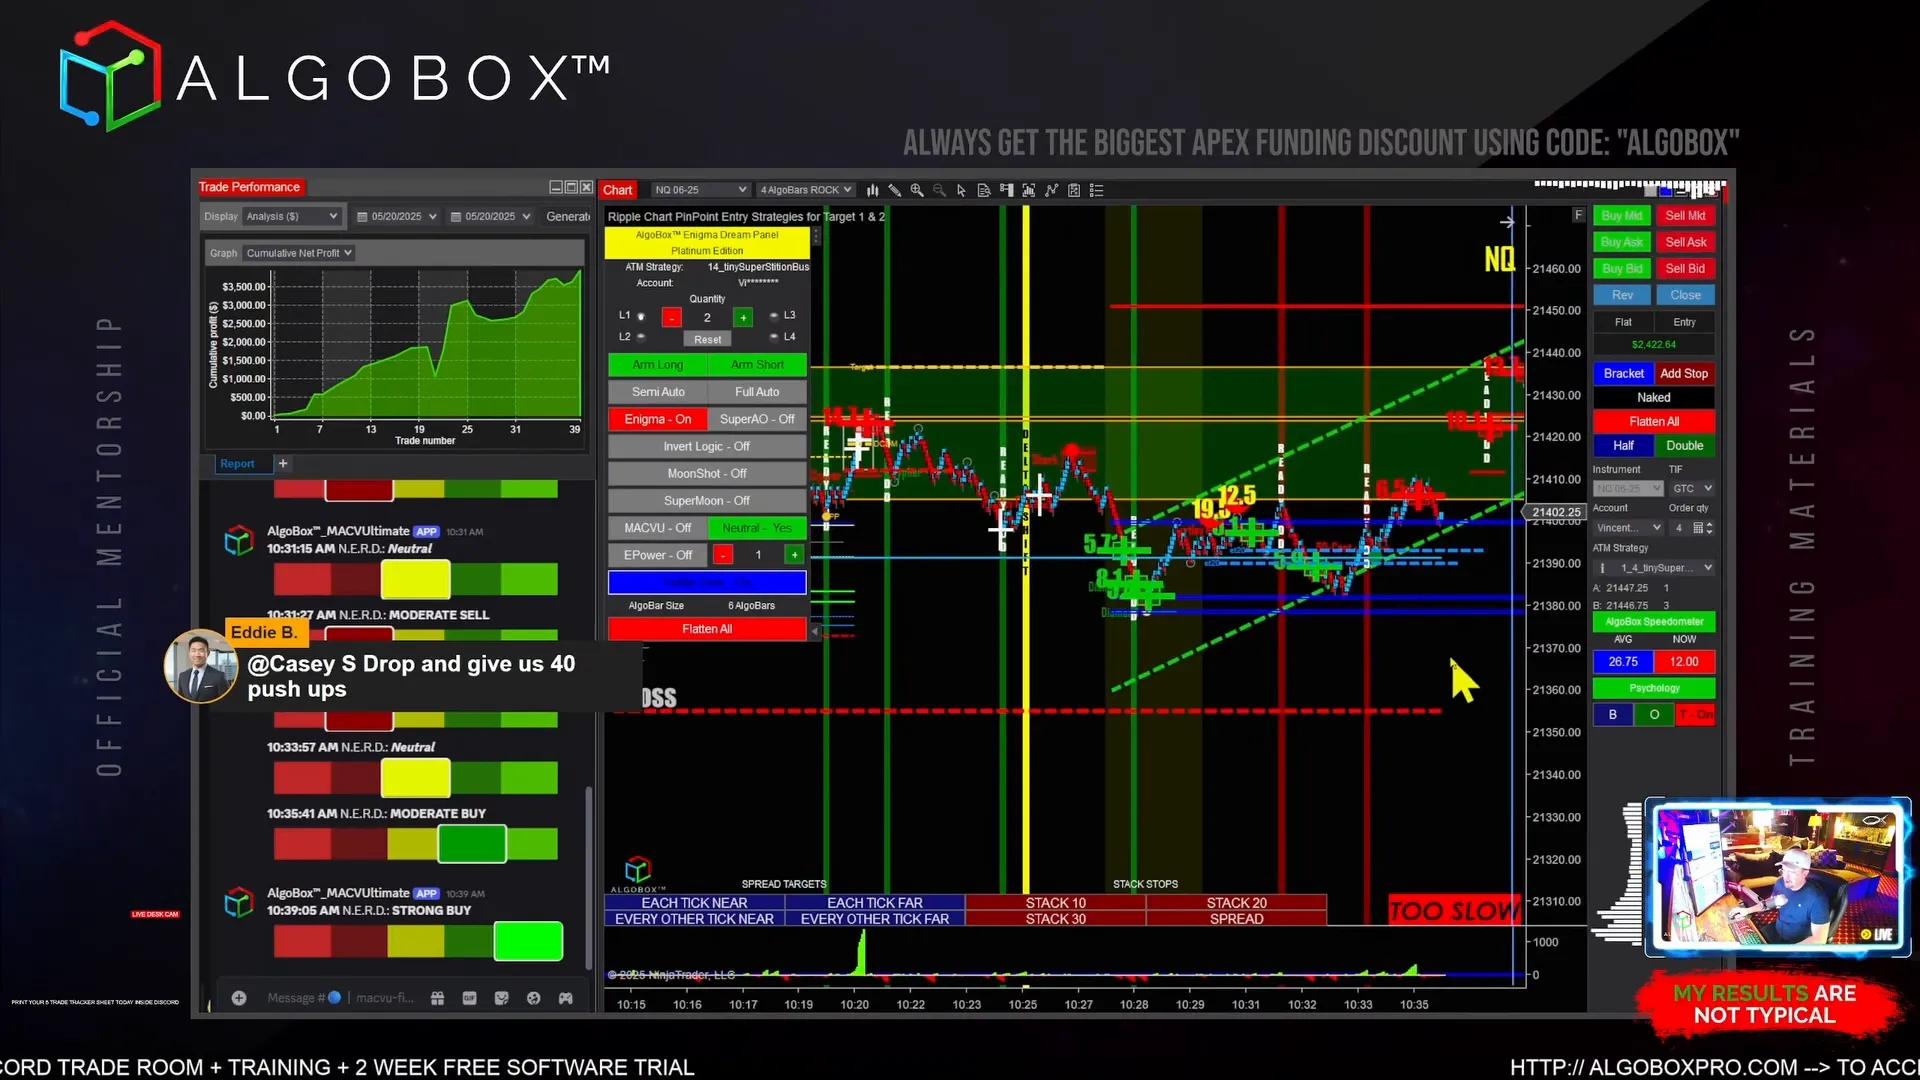
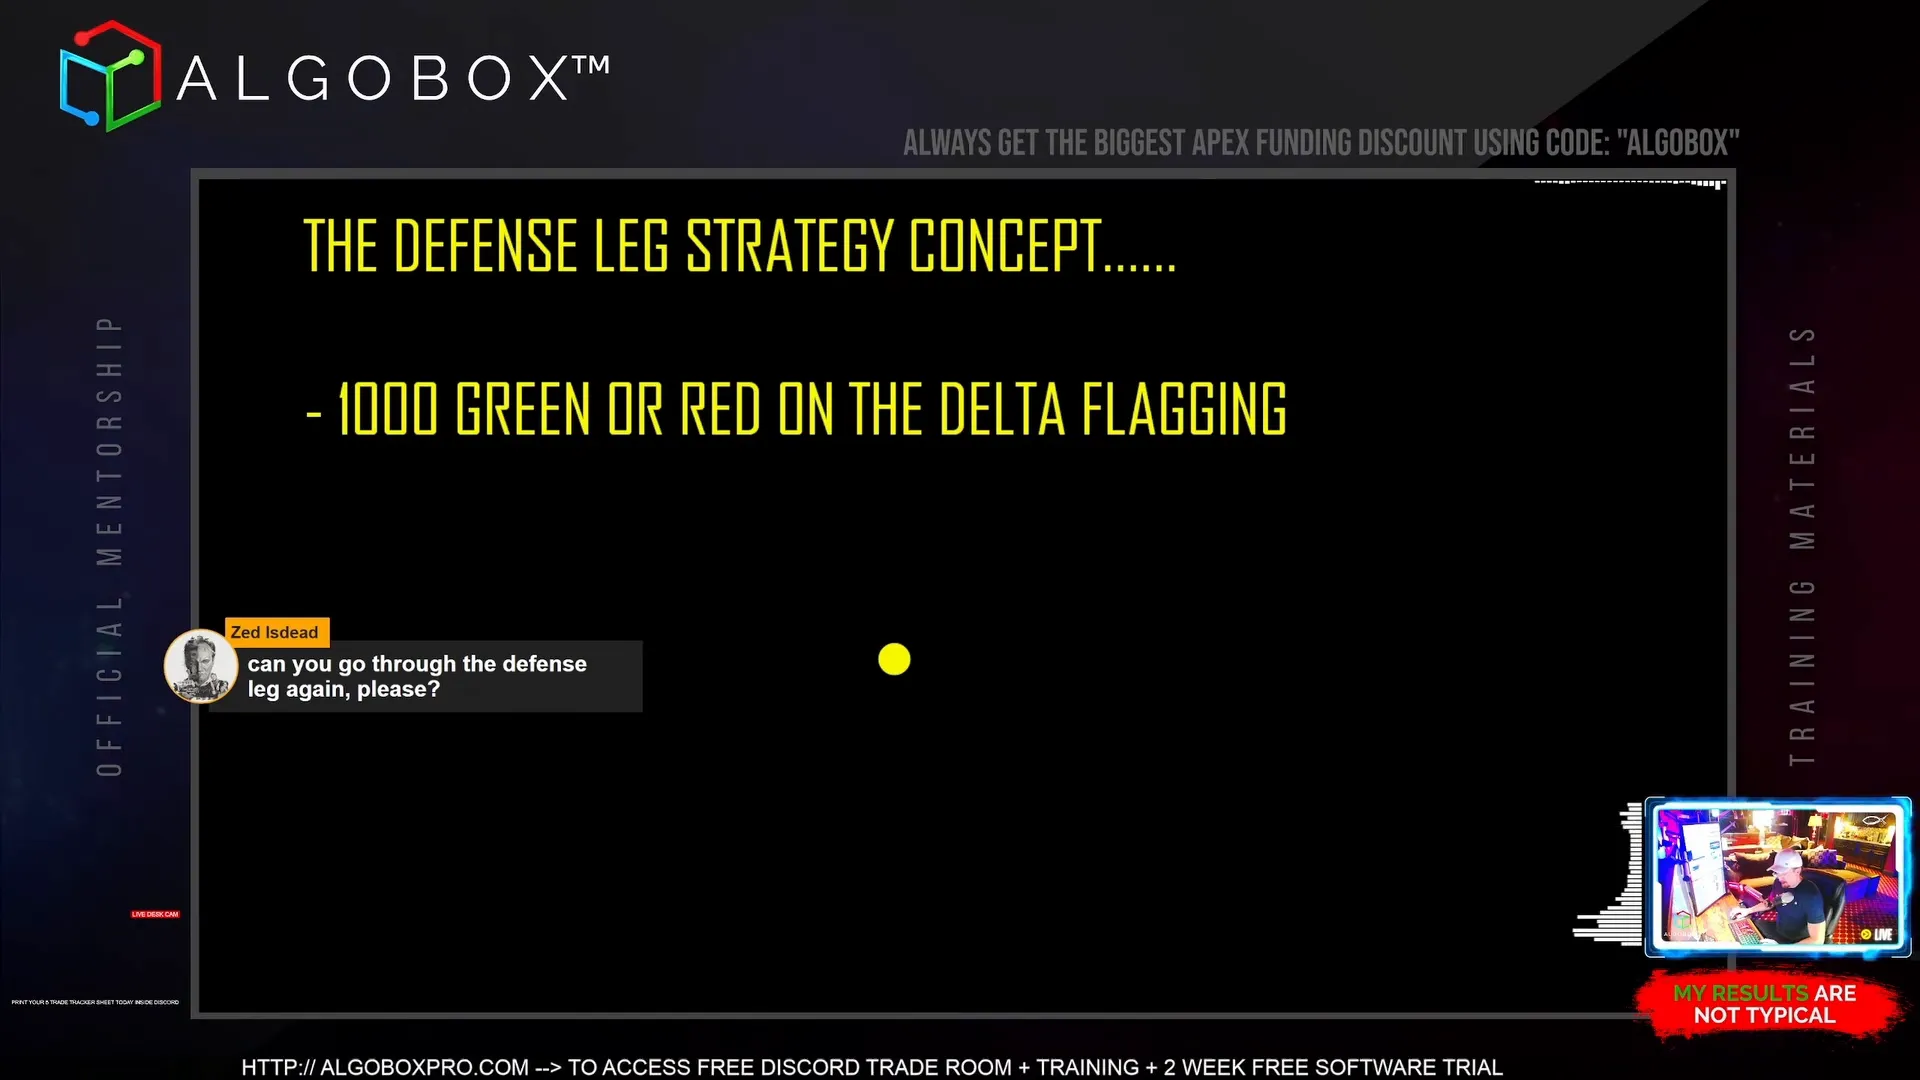
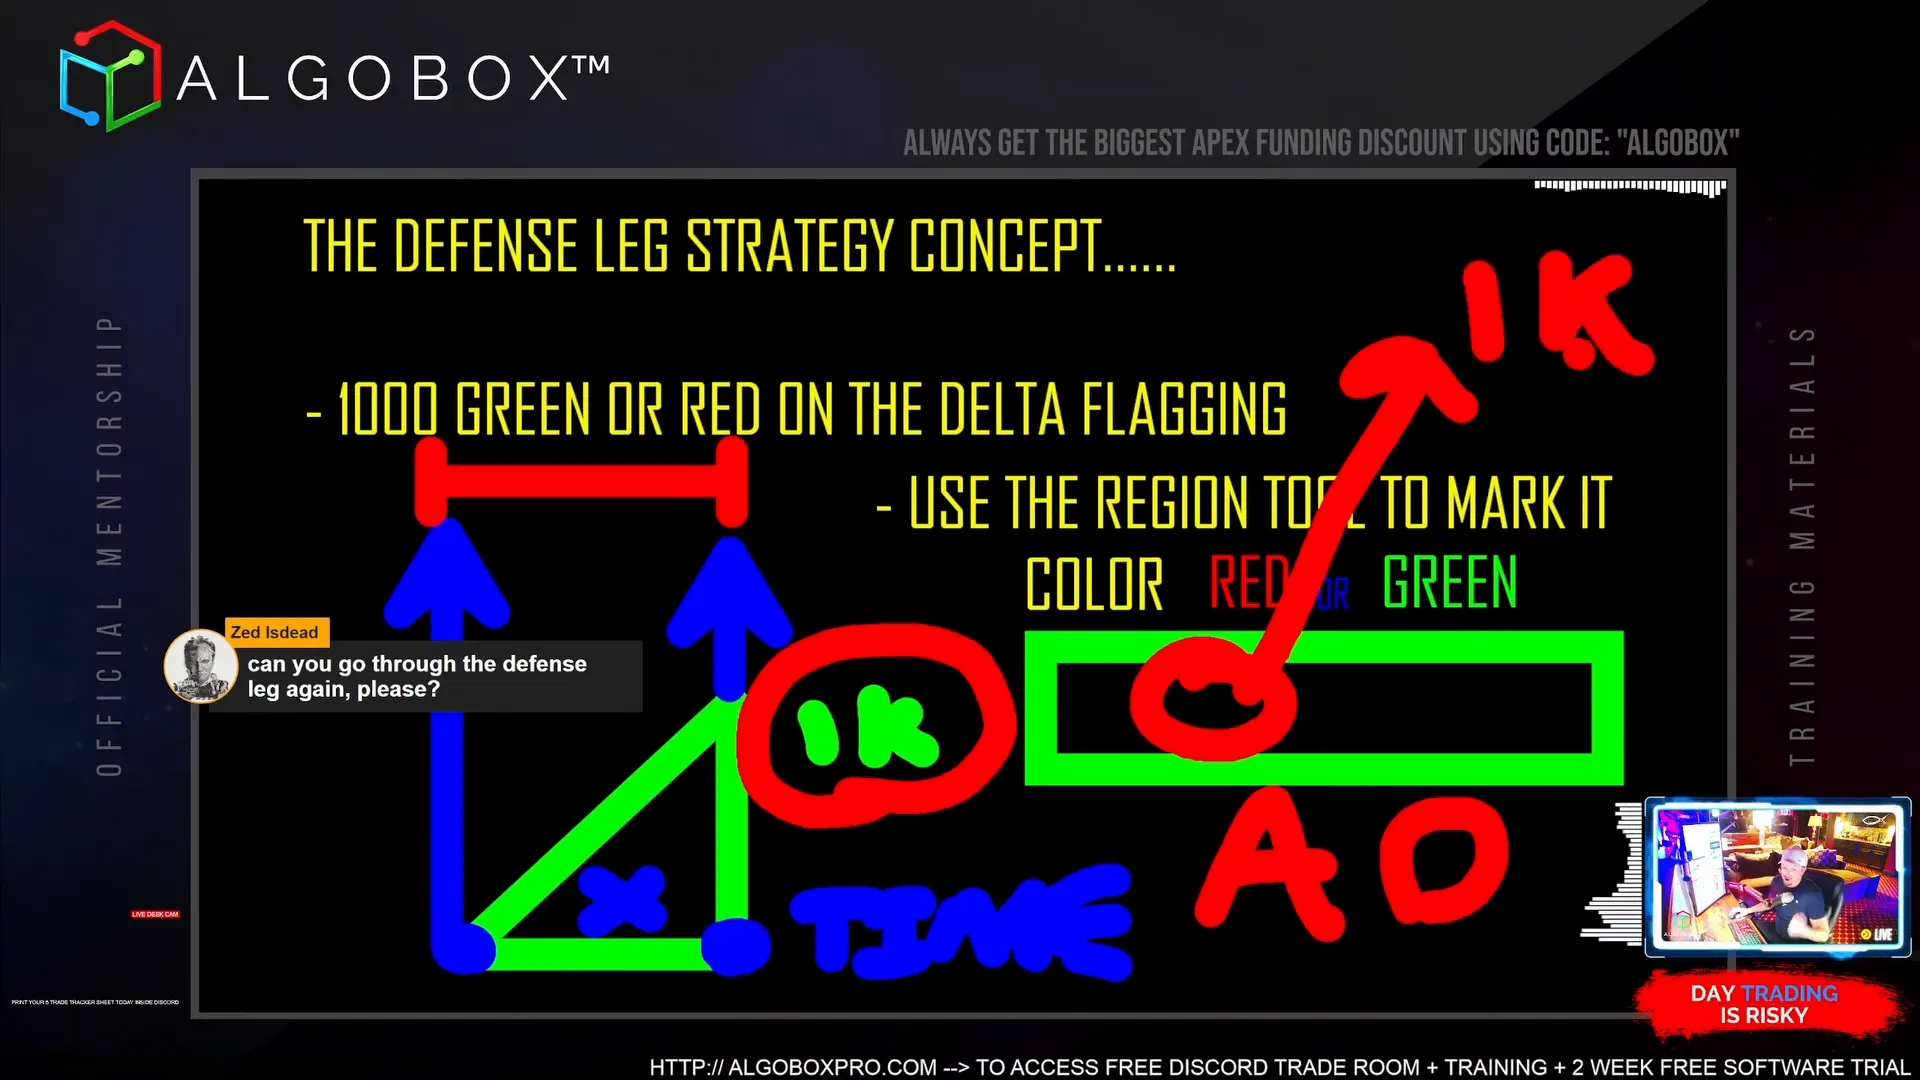
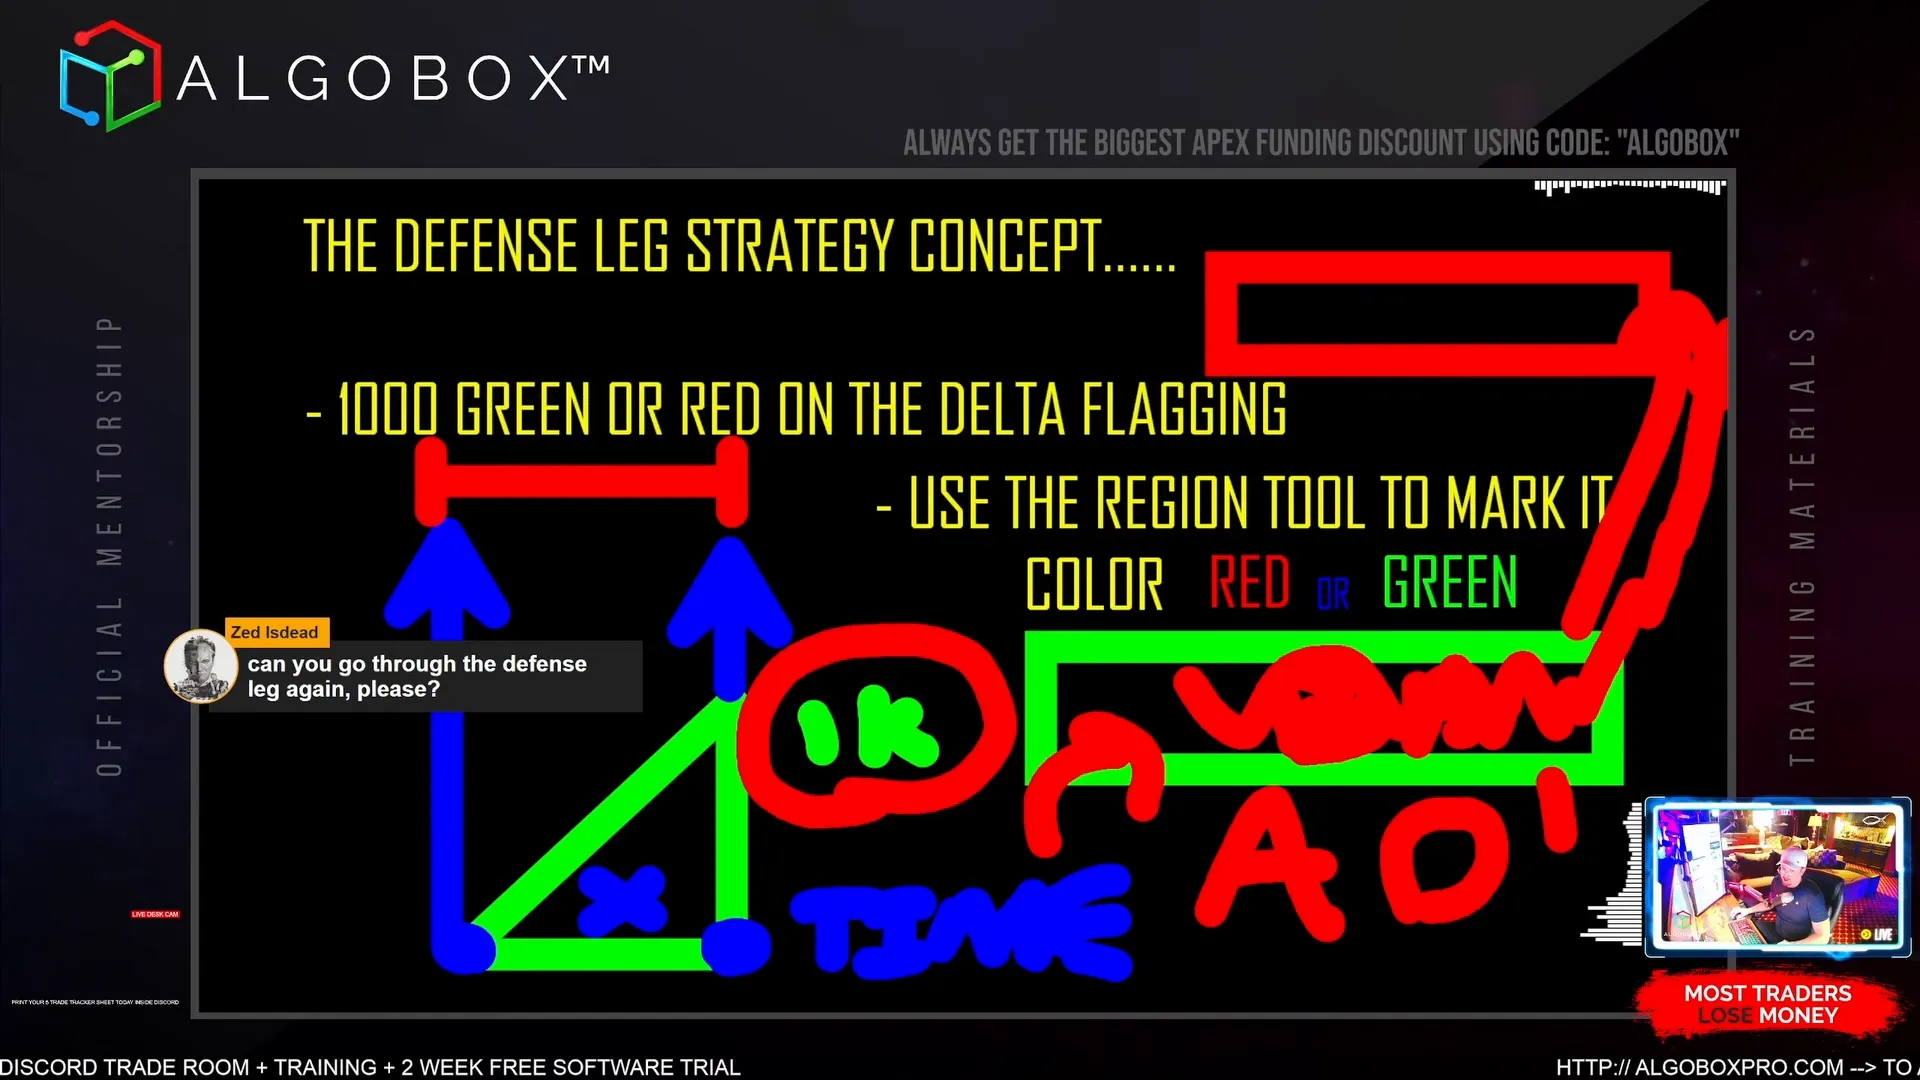
Identifying a spike in volume is just the beginning. To confirm that this is indeed a Defense Leg, I analyze the Delta volume — the difference between buying and selling volume — and look for a reading over 1,000 contracts on the delta flagging.
This delta volume confirms that the big players are not just trading large volumes but are actively defending their positions. For instance, if the delta is over 1,000 in red, it means sellers are strongly defending a zone. Conversely, a green delta over 1,000 indicates buyers are defending.
It’s important to note that a strong delta in the opposite direction can cancel out a previously identified Defense Leg. So, continuous monitoring of delta volume is essential to determine if the defense zone remains valid or if it has been breached.
Step 3: Identifying the Pivot Point for Price Projection
Once the Defense Leg zone is established, the next step is to find the pivot point just before the price entered the defense zone. This pivot is critical because it represents the last significant turning point before the defense leg was created.
I use my charting tool’s F8 key (the Bib tool) to measure the distance from this pivot to the Defense Leg zone. This distance helps me project where the market might move next, which is usually a “double move” past the defense leg area.
The idea here is that the market movers want to push the price far enough beyond their defended zone to make a profit. They can’t simply enter and exit at precise points because of the large volume they control, so they need zones of space to operate efficiently.
By measuring from the pivot to the defense leg, I can project a target zone above (or below) the defense leg where I expect the price to head before the big players start taking profits.
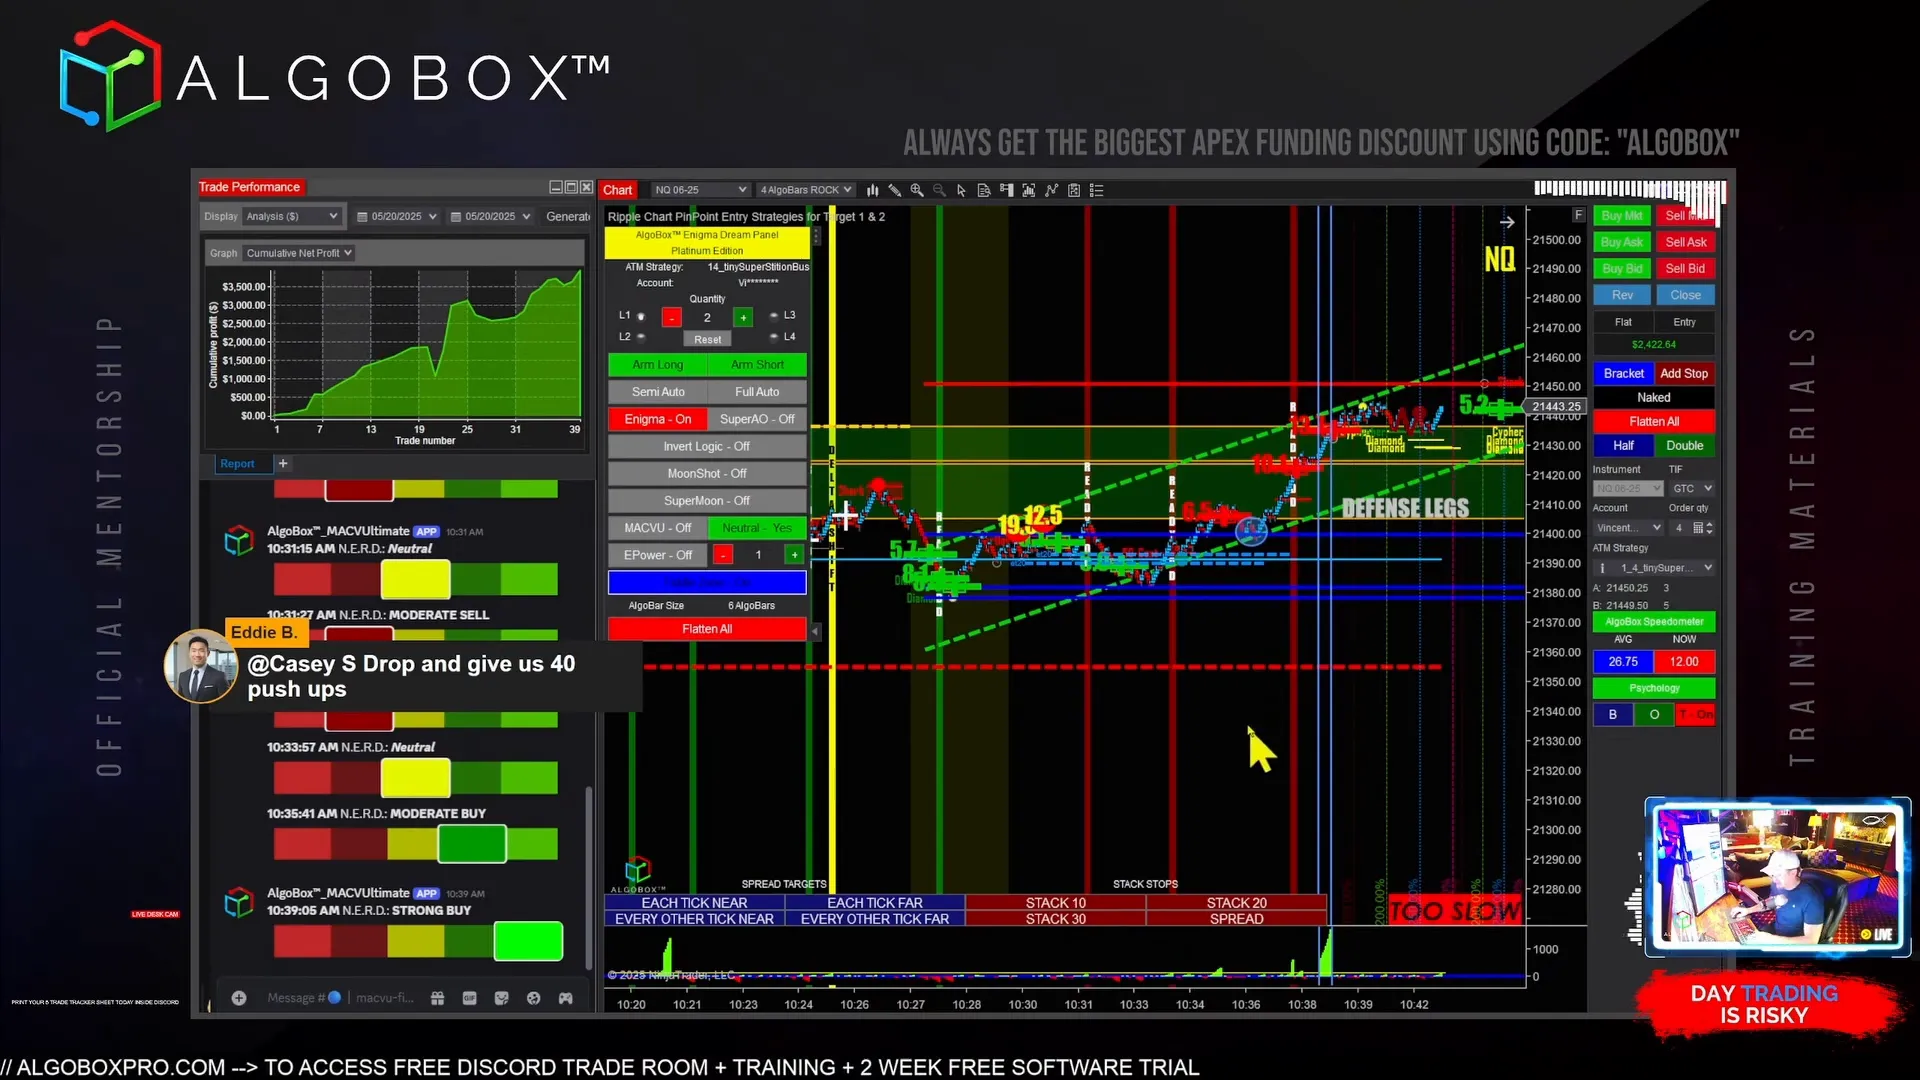
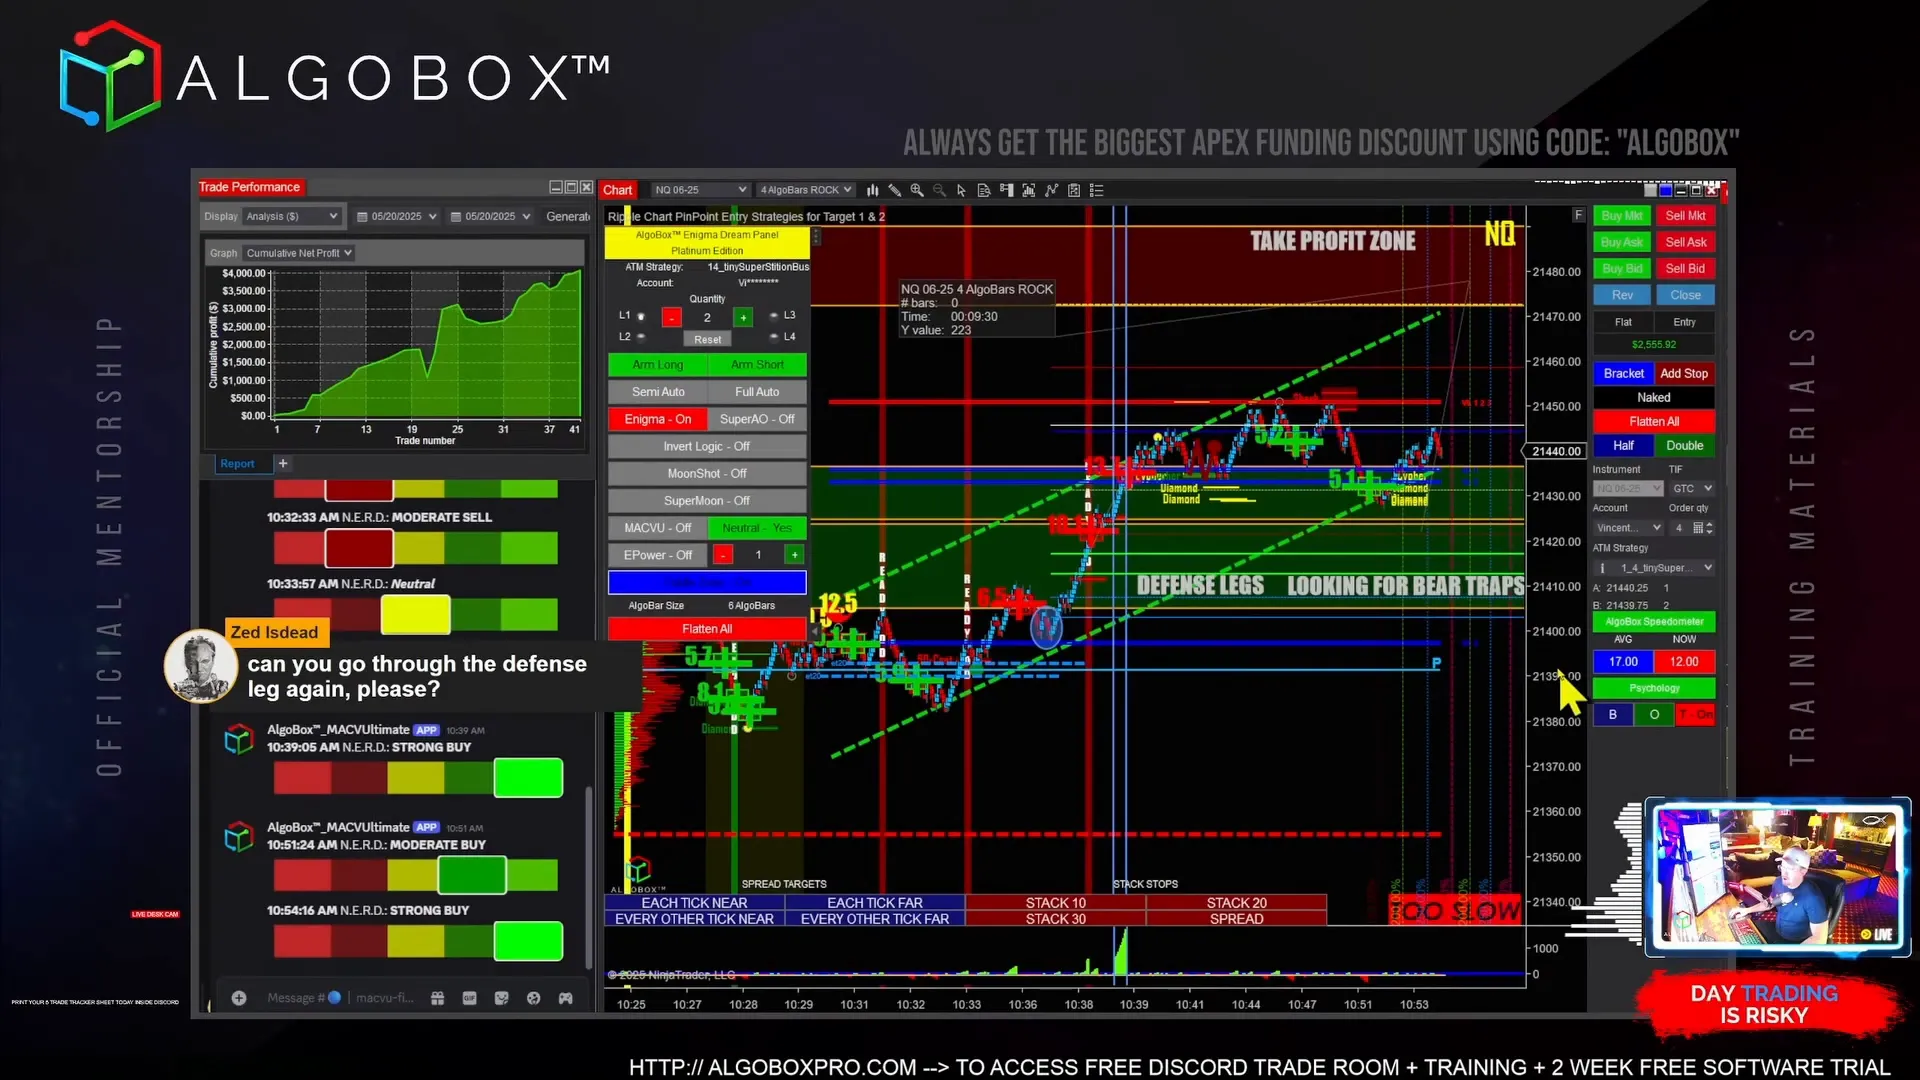
Step 4: Drawing the Take Profit Zone
After projecting the price extension from the pivot to the defense leg, I draw a Take Profit Zone on the chart. This zone represents the target area where I expect the big players to start unloading their contracts and taking profits.
The distance from the defense leg zone to the take profit zone is typically similar to the distance from the pivot to the defense leg. This “double move” ensures that the big players maximize their gains by pushing the price a sufficient distance beyond their defended zone.
For example, if the distance from the pivot to the defense leg is 173 ticks, then the take profit zone will be approximately 173 ticks above the defense leg. This symmetry is a hallmark of the Defense Leg strategy and helps me plan my exit points precisely.
Within this take profit zone, I watch closely for signs of price stalling or reversal, which often indicate that the big players are selling into the market.
Step 5: Understanding Why the Defense Leg Works
Now that you know how to identify and use the Defense Leg, it’s important to understand why this strategy works so well in futures trading.
The Defense Leg represents a zone where large traders have made significant purchases or sales. These big players are not looking to lose money. Having committed thousands of contracts, they will defend these zones vigorously to protect their positions.
Typically, the big players accumulate contracts by running stops or pushing retail traders into the wrong side of the market. Once they have “collected their check,” they may fake out the market to trap retail traders further and accumulate even more contracts.
When the price returns to the Defense Leg zone, retail traders often think the market will continue against the big players, leading to more short or long positions depending on the direction. However, the big players defend this zone, preventing the price from breaking through easily.
This defensive behavior creates predictable price patterns, allowing traders like me to anticipate market moves and align with the big players rather than against them.
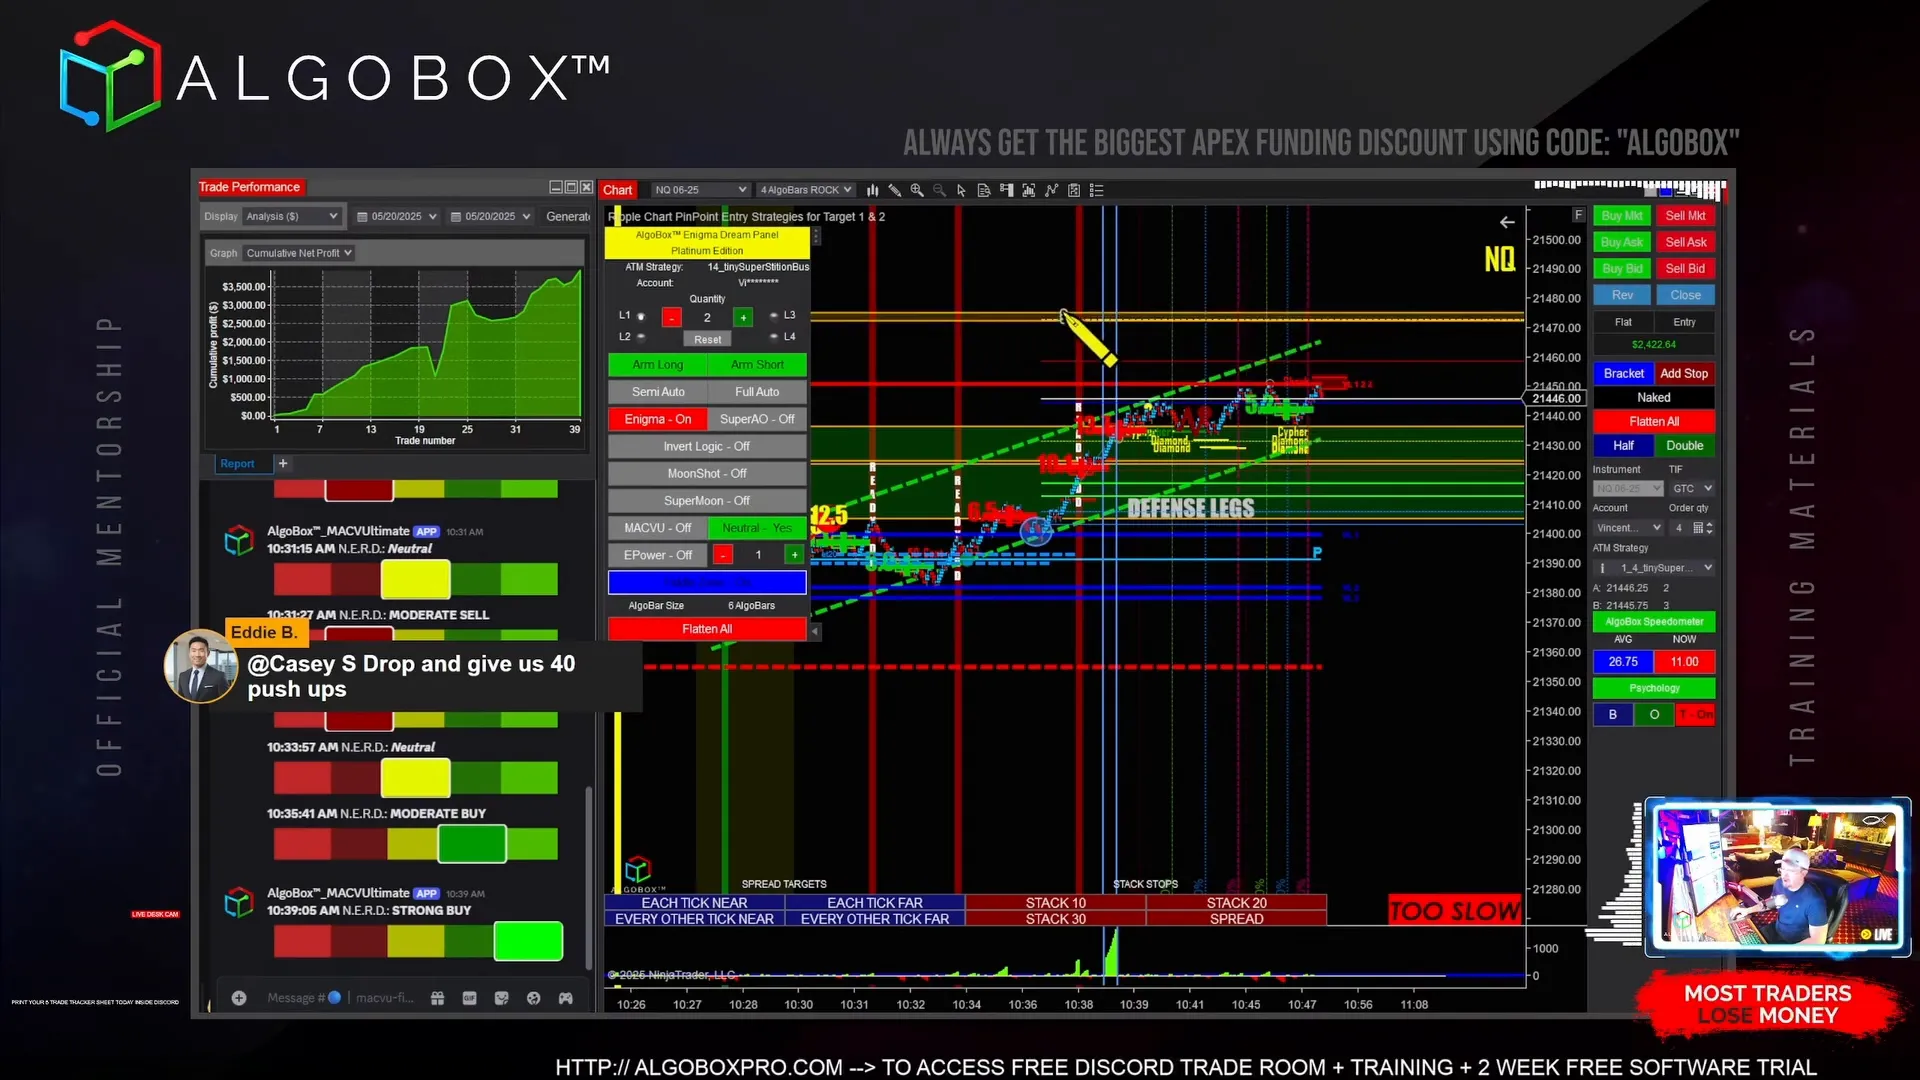
Step 6: Navigating Price Action Within the Defense Leg
During the trading day, price often dips into the Defense Leg zone multiple times. This can create the appearance of weakness or strength depending on the direction, causing retail traders to enter positions expecting a breakout.
However, because the big players are defending this area, these moves are often traps. For example, if the Defense Leg is green (buyers defending), dips into that zone are bear traps—false moves lower designed to induce shorts who then get squeezed out.
Conversely, if the Defense Leg is red (sellers defending), rallies into that zone can be bull traps. Recognizing these traps is crucial to avoid getting caught on the wrong side and to find the best entry points aligned with the big players.
Patience and discipline are key here. I focus on waiting for price to enter the Defense Leg zone and then look for signs of a trap, such as sudden reversals or volume spikes against the prevailing retail sentiment.
Step 7: Watching for the Opposing 1,000 Contract Move
The Defense Leg strategy also involves monitoring for the opposing 1,000 contract move that signals the end of the defense phase. This is the point where the big players have sold off enough contracts to exit their position.
This volume may not appear all at once but rather in batches that add up to around 1,000 contracts. When this cumulative volume is observed, it often indicates that the big players have completed their movement and the market may shift direction or enter a new phase.
Recognizing this moment allows me to adjust my trading plan accordingly, either locking in profits or preparing for the next trade setup.
Step 8: Aligning with the Big Players for Consistent Profits
One of the biggest advantages of the Defense Leg strategy is that it helps you “run with the big guys.” By identifying where institutional traders have made significant moves, you can position yourself alongside them rather than against them.
This alignment reduces the risk of being caught in sudden market reversals and increases the probability of profitable trades. While the Defense Leg strategy doesn’t guarantee home runs every time, it allows for consistent “base hits” that build profits steadily over time.
When retail traders experience pain inside the Defense Leg zone—such as being trapped in losing positions—that’s often when the best trading opportunities arise. The big players exploit these moments to push the market in their favor, and savvy traders can capitalize on these moves.
Step 9: Practical Tips for Implementing the Defense Leg Strategy
- Set a Volume Threshold: Use 1,000 contracts as your baseline for identifying significant volume spikes.
- Use Delta Volume: Confirm defense legs with delta readings over 1,000 to ensure the move is defended by big players.
- Mark Zones Clearly: Draw defense leg zones and take profit zones on your charts for clear visual reference.
- Find Pivots: Identify the pivot before the defense leg to project price targets.
- Watch for Traps: Learn to recognize bear and bull traps within the defense leg zone for optimal entries.
- Follow the Big Players: Trade in the direction of the Defense Leg to increase your chances of success.
- Be Patient: Wait for confirmation signals before entering trades.
- Manage Risk: Use stop losses outside of the defense leg zone to protect your capital.
Step 10: Tools to Enhance Your Defense Leg Trading
To implement the Defense Leg strategy effectively, I rely on specialized tools like AlgoBox for NinjaTrader. This software helps automate the detection of volume spikes and delta readings, making it easier to spot Defense Legs without sifting through raw data manually.
AlgoBox also allows you to save your workspace with all your defense leg markings, pivots, and profit zones intact, which is critical during fast-moving markets or platform crashes.
Additionally, using the F8 measurement tool built into NinjaTrader lets me quickly project targets and plan my entries and exits with precision.
Conclusion: Mastering the Defense Leg for Smarter Day Trading
The Defense Leg is a powerful concept that gives you a window into the behavior of the market’s largest players. By identifying these zones, confirming them with delta volume, projecting price targets, and understanding the psychology behind the moves, you can significantly improve your day trading results.
This strategy is not about guessing or relying on luck. It’s about reading the footprints of the big players and aligning your trades with their intentions. When you trade the Defense Leg, you trade with the edge, reducing risk and increasing your chances of consistent profits.
If you want to take your trading to the next level, I encourage you to explore tools like AlgoBox for NinjaTrader that make applying this strategy straightforward and effective. Remember, trading is a journey of continuous learning and adaptation. The Defense Leg strategy is a vital part of that journey.