
Welcome to Day 2 of our comprehensive Algo Futures Trading Course, designed to help you master algorithmic trading using NinjaTrader. In this detailed tutorial, we will dive deep into platform basics, workspace management, and advanced trading strategies to get you up to speed quickly and efficiently. Whether you’re a beginner or looking to refine your skills, this guide will walk you through essential steps to optimize your trading setup and execution.
This course builds on foundational knowledge, so if you haven’t completed Day 1, it’s highly recommended to revisit that before proceeding. Let’s jump right into the core of Day 2 and lay out how to manage your workspace, configure your charts, and understand the key concepts that drive smart algorithmic futures trading.
Table of Contents
- Step 1: Understanding Workspace Management and Layouts
- Step 2: Chart Layouts and Configurations
- Step 3: Chart Types and Their Roles
- Step 4: Optimizing Your Charts for Market Conditions
- Step 5: Gear Shifting and Bar Size Adjustments
- Step 6: NinjaTrader Interface Basics for AlgoBox
- Step 7: Market Replay and Playback Practice
- Step 8: Hot Keys and Chart Controls
- Step 9: Practical Tips and Community Resources
- Step 10: Final Words and Encouragement
Step 1: Understanding Workspace Management and Layouts
Workspace management is crucial in algorithmic trading. Your workspace is your command center, where you monitor market data, execute trades, and analyze your performance. Having an efficient layout tailored to your hardware and trading style can make a significant difference in your effectiveness.
Everyone’s computer setup differs, so while there’s no one-size-fits-all, I’ll share my recommended layout based on years of experience trading with AlgoBox tools.
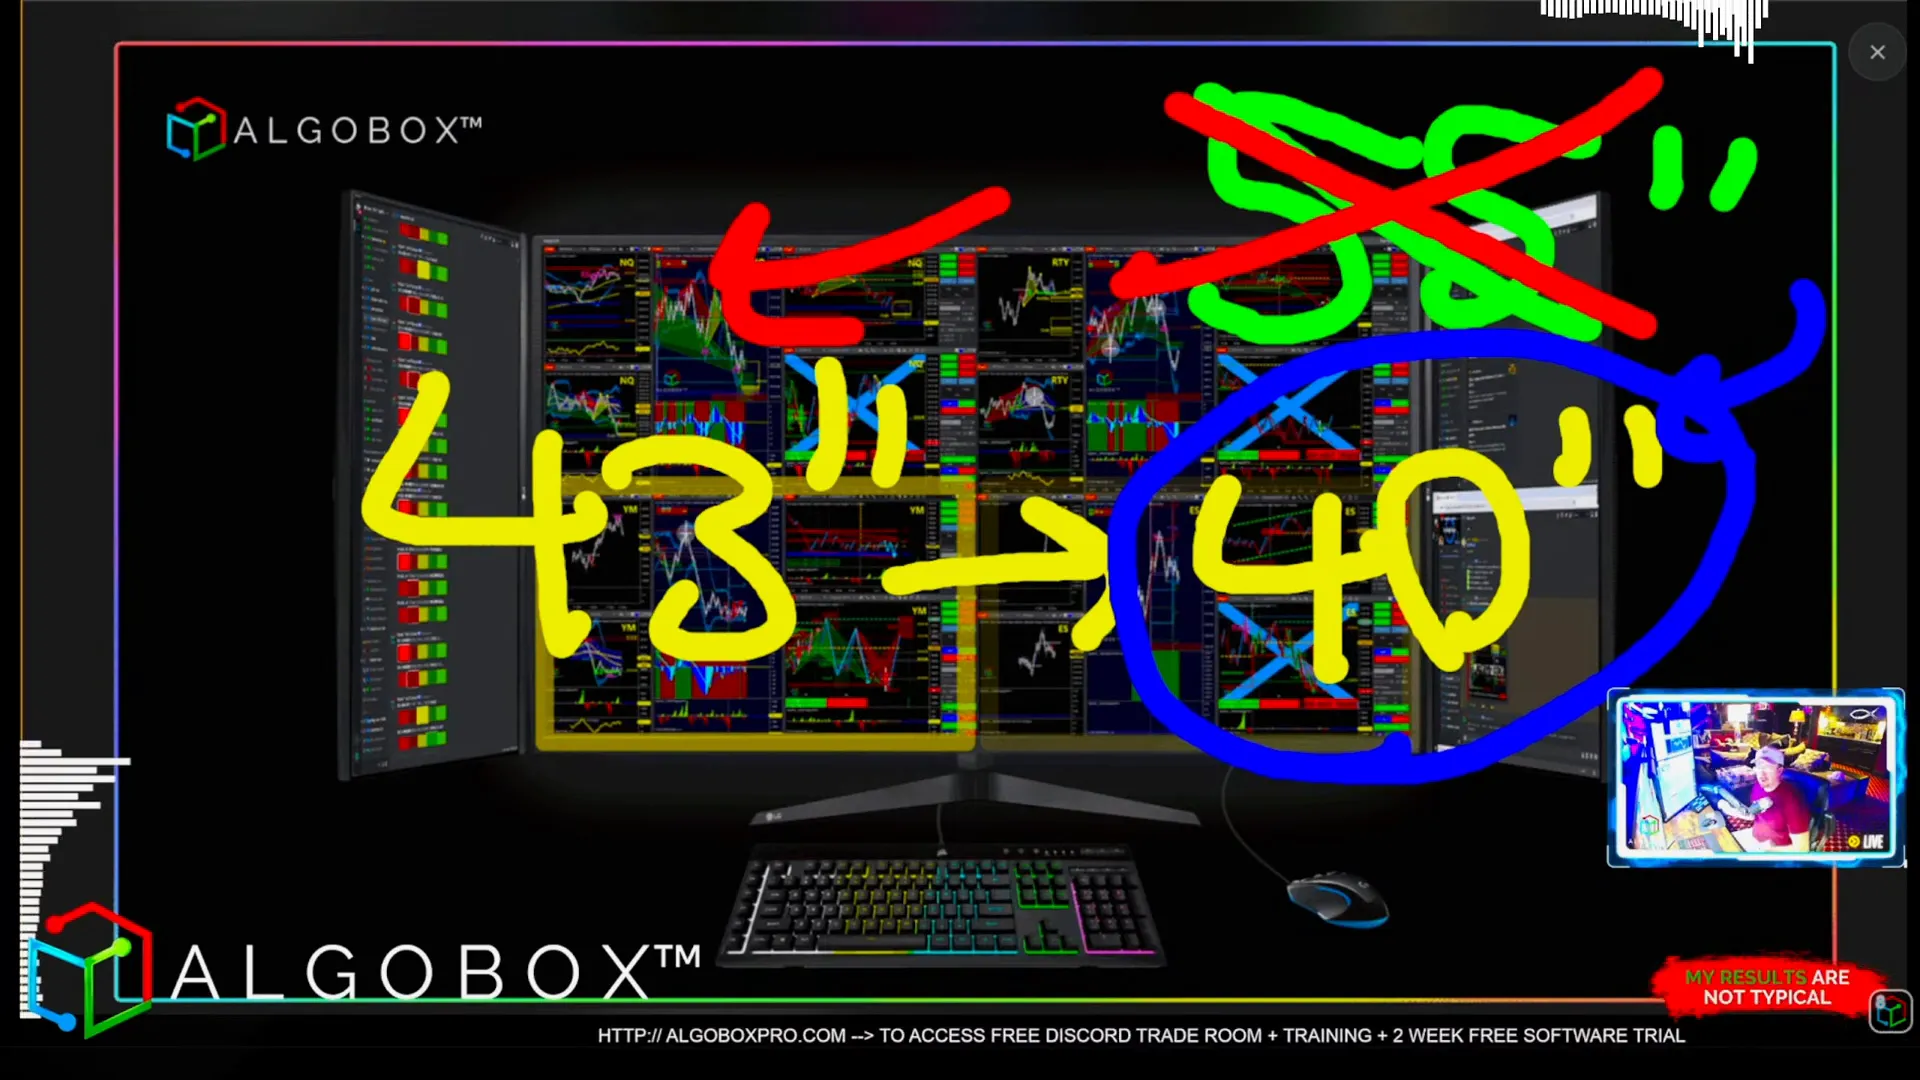
Recommended Monitor Setup
These days, 43-inch 4K monitors are affordable and ideal for a trading setup. You can find them at retail stores like Walmart for under $300. I personally recommend using a 40 or 43-inch monitor as your center screen. While I previously used a 55-inch monitor, I found it too large and straining on my neck due to its size and positioning.
Here’s why:
- A 40-inch monitor offers the perfect balance of screen real estate and comfort. It fits well within your natural field of vision without requiring excessive head movement.
- 43-inch monitors are a great alternative if a 40-inch is hard to find. They still provide ample space but may require slight adjustment.
- Buying a monitor that’s too large can cause physical discomfort and reduce your ability to focus on critical data.
Once you have your center screen set, flank it with two additional monitors to the sides. I recommend placing them both on one side (either left or right) for balanced visibility and ease of access.
This setup gives you plenty of pixel space for multiple windows, such as Discord chats, news feeds, and other third-party tools.
Discord Layout Recommendations
Discord is an essential communication platform for traders in our community. However, the Discord app can be limiting because it only allows one window per instance.
My recommendation is to use the browser version of Discord instead of the app. The browser allows you to open multiple tabs, which is perfect for managing different chats simultaneously.
- Open at least two Discord windows: one for the public chat and one for the news feed.
- Keep these windows arranged consistently to develop muscle memory and reduce cognitive load.
- Consider installing browser extensions like “Discord Sidebar Hider” to maximize your screen space by hiding unnecessary sidebars.
Additional Screen Space Considerations
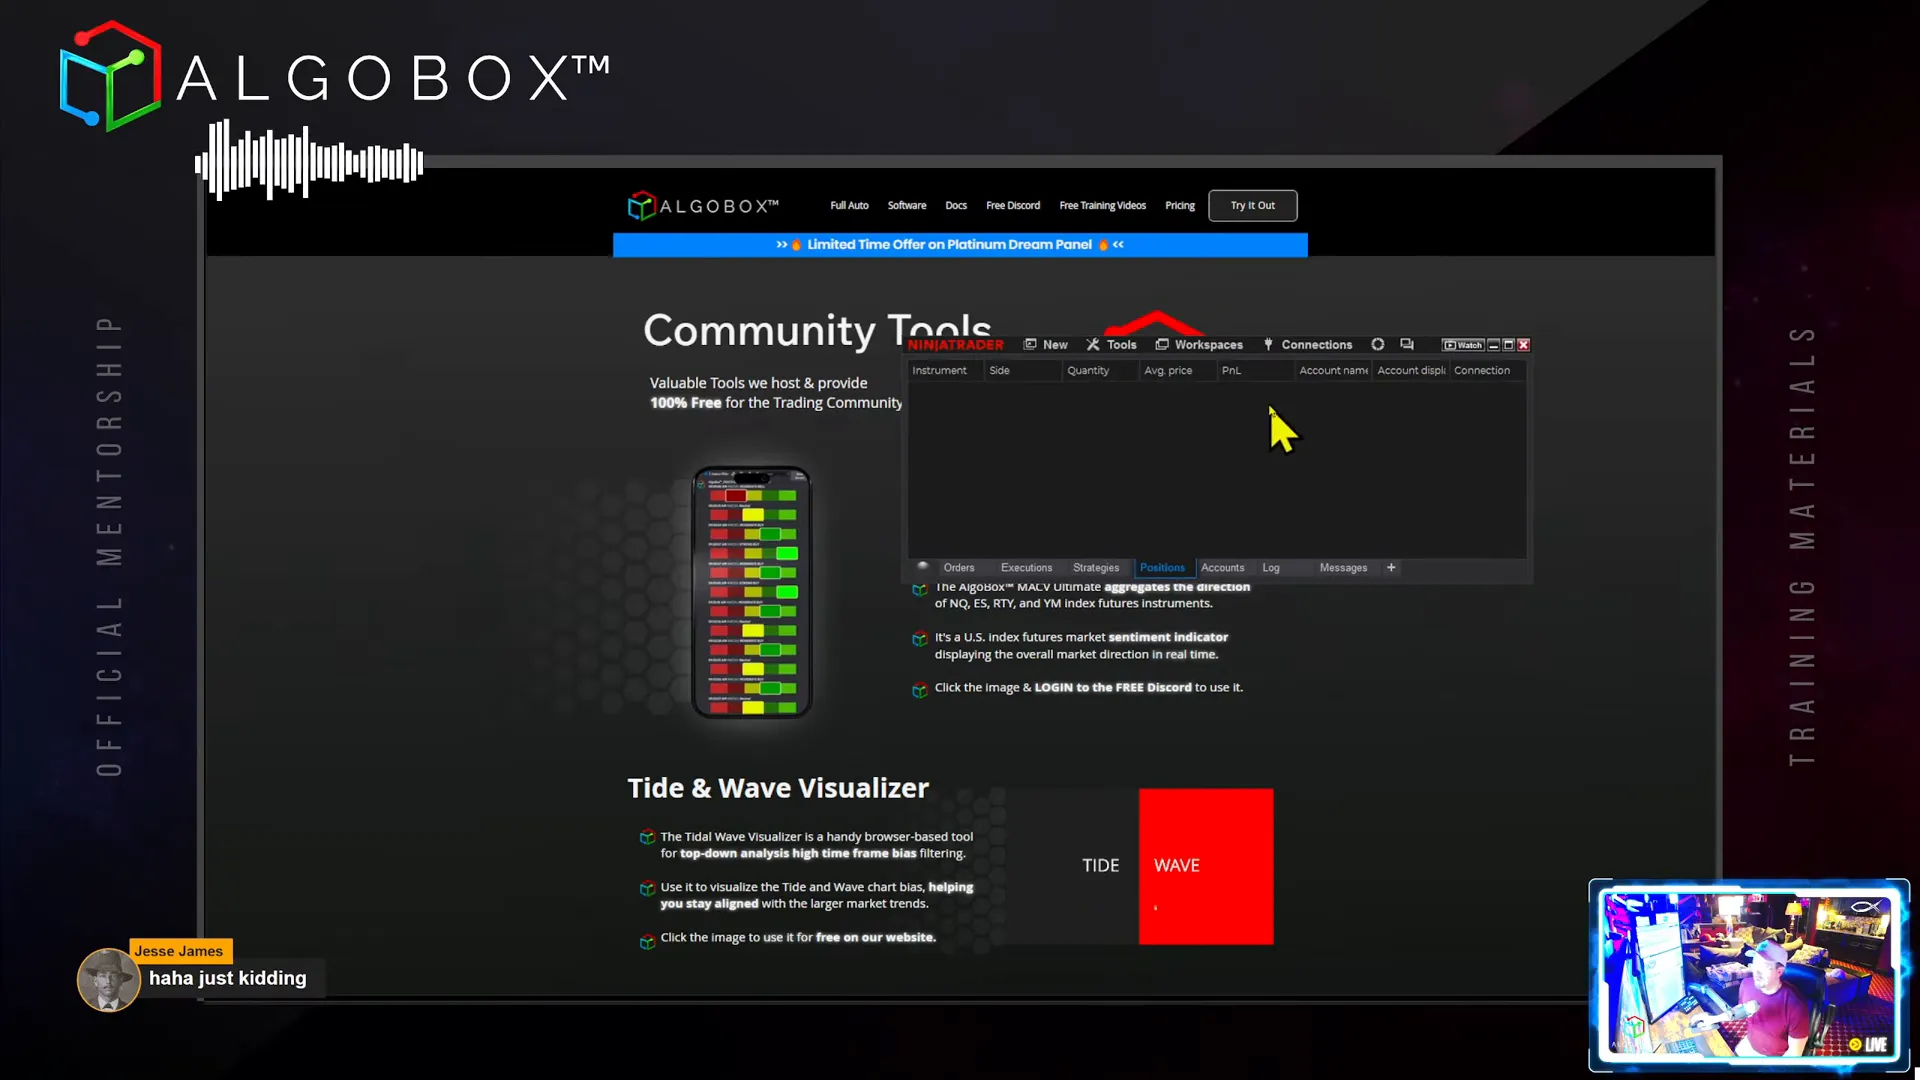
On your left monitor, you might want to dedicate space for the Mac V Ultimate indicator, which provides a comprehensive directional filter across correlated instruments. This indicator is a powerful tool often used in live streams and can be placed on a separate device such as a phone or tablet if you have limited screen real estate.
Additionally, consider placing other useful tools nearby, such as the Financial Juice room, Trump tweets section on Truth Social, or screenshot tools like Snagit.
Step 2: Chart Layouts and Configurations
Now that you have a basic workspace setup, it’s time to organize your charts effectively. The chart layout is the heart of your trading system, providing the visual data you need to make decisions.
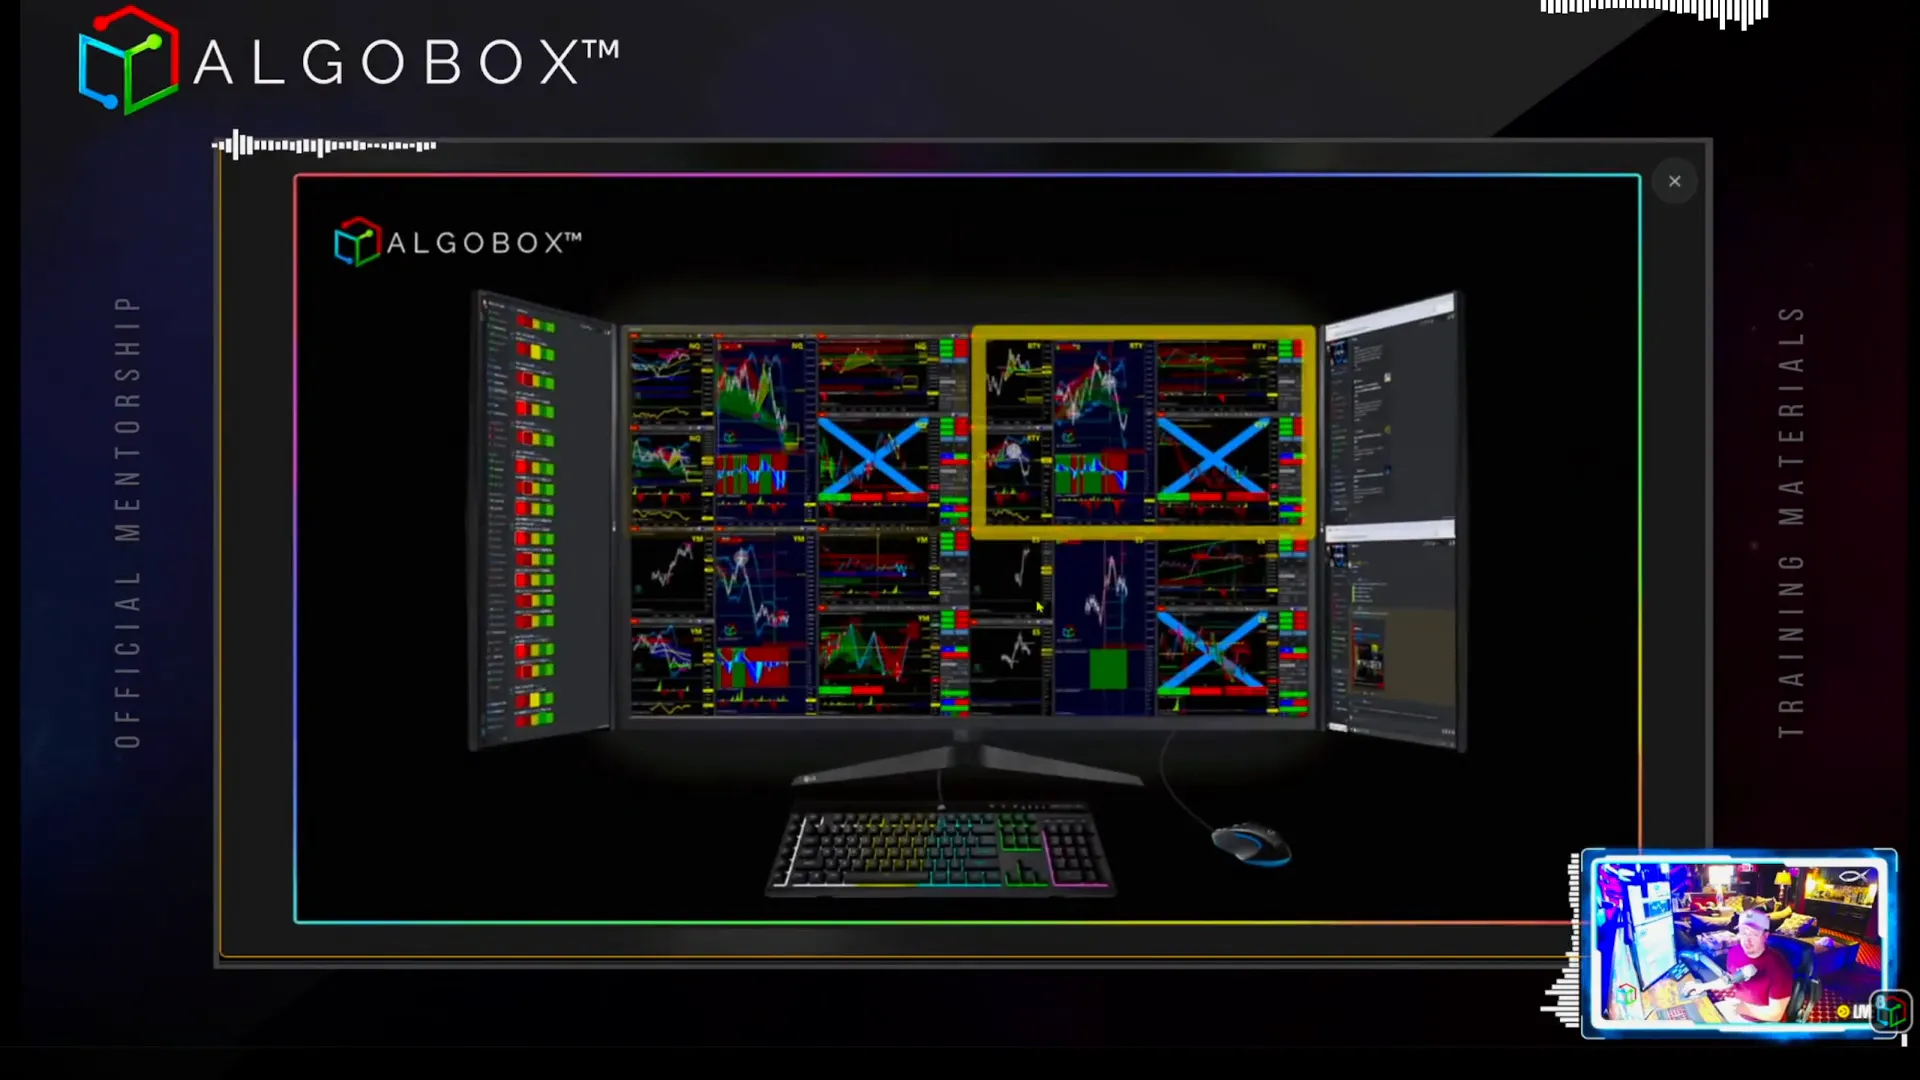
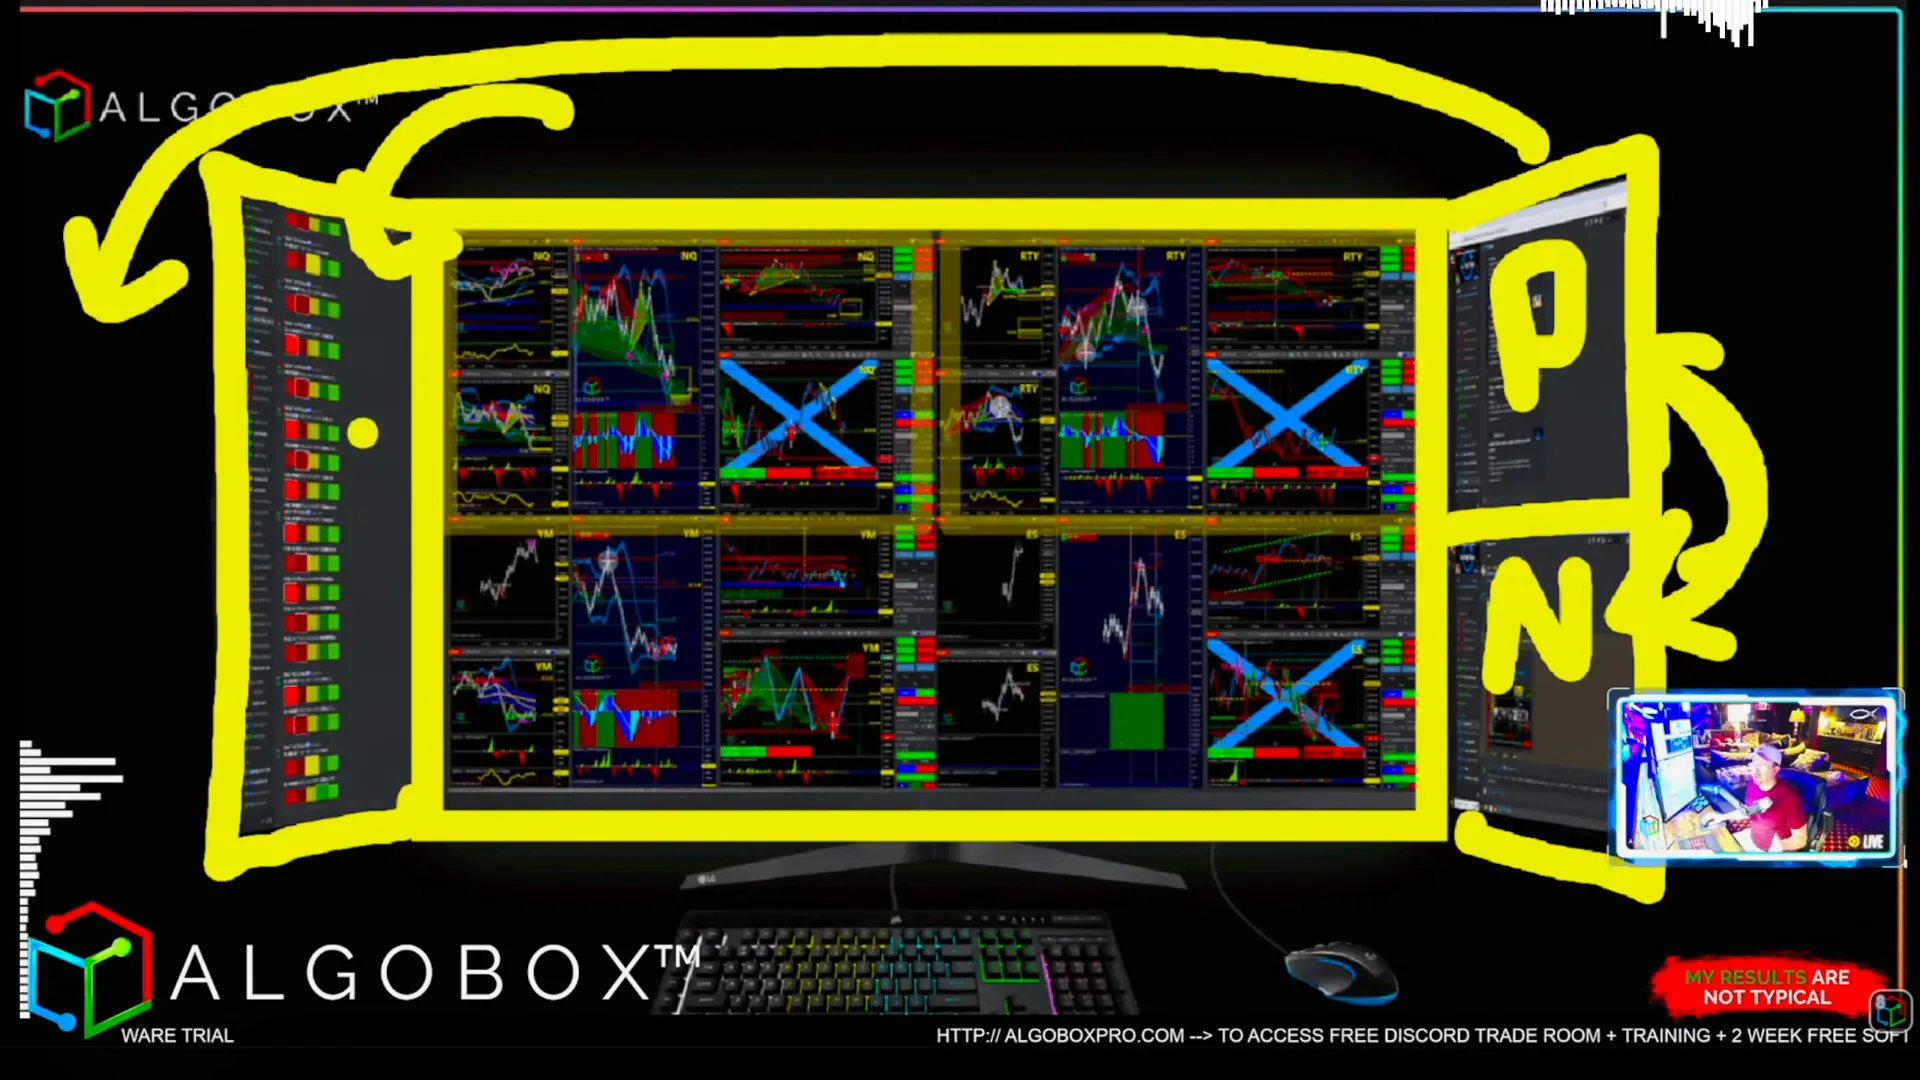
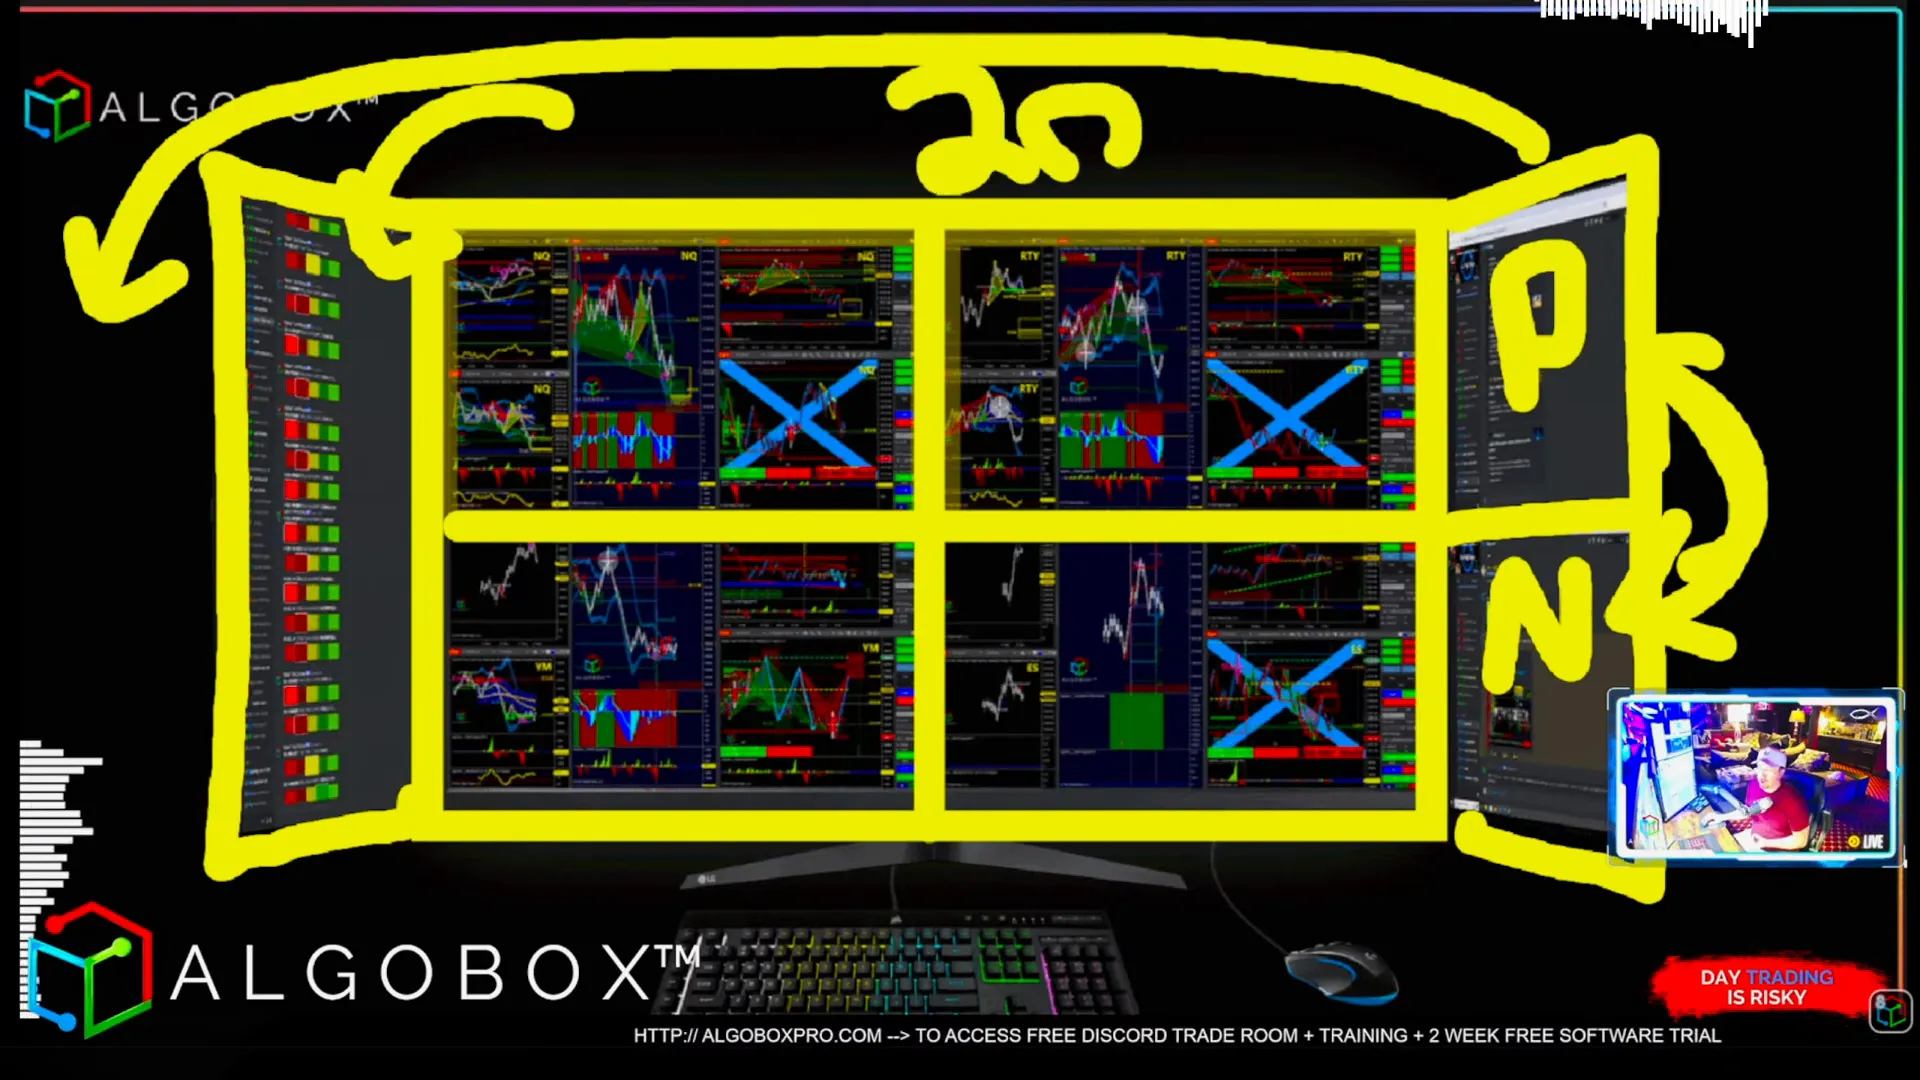
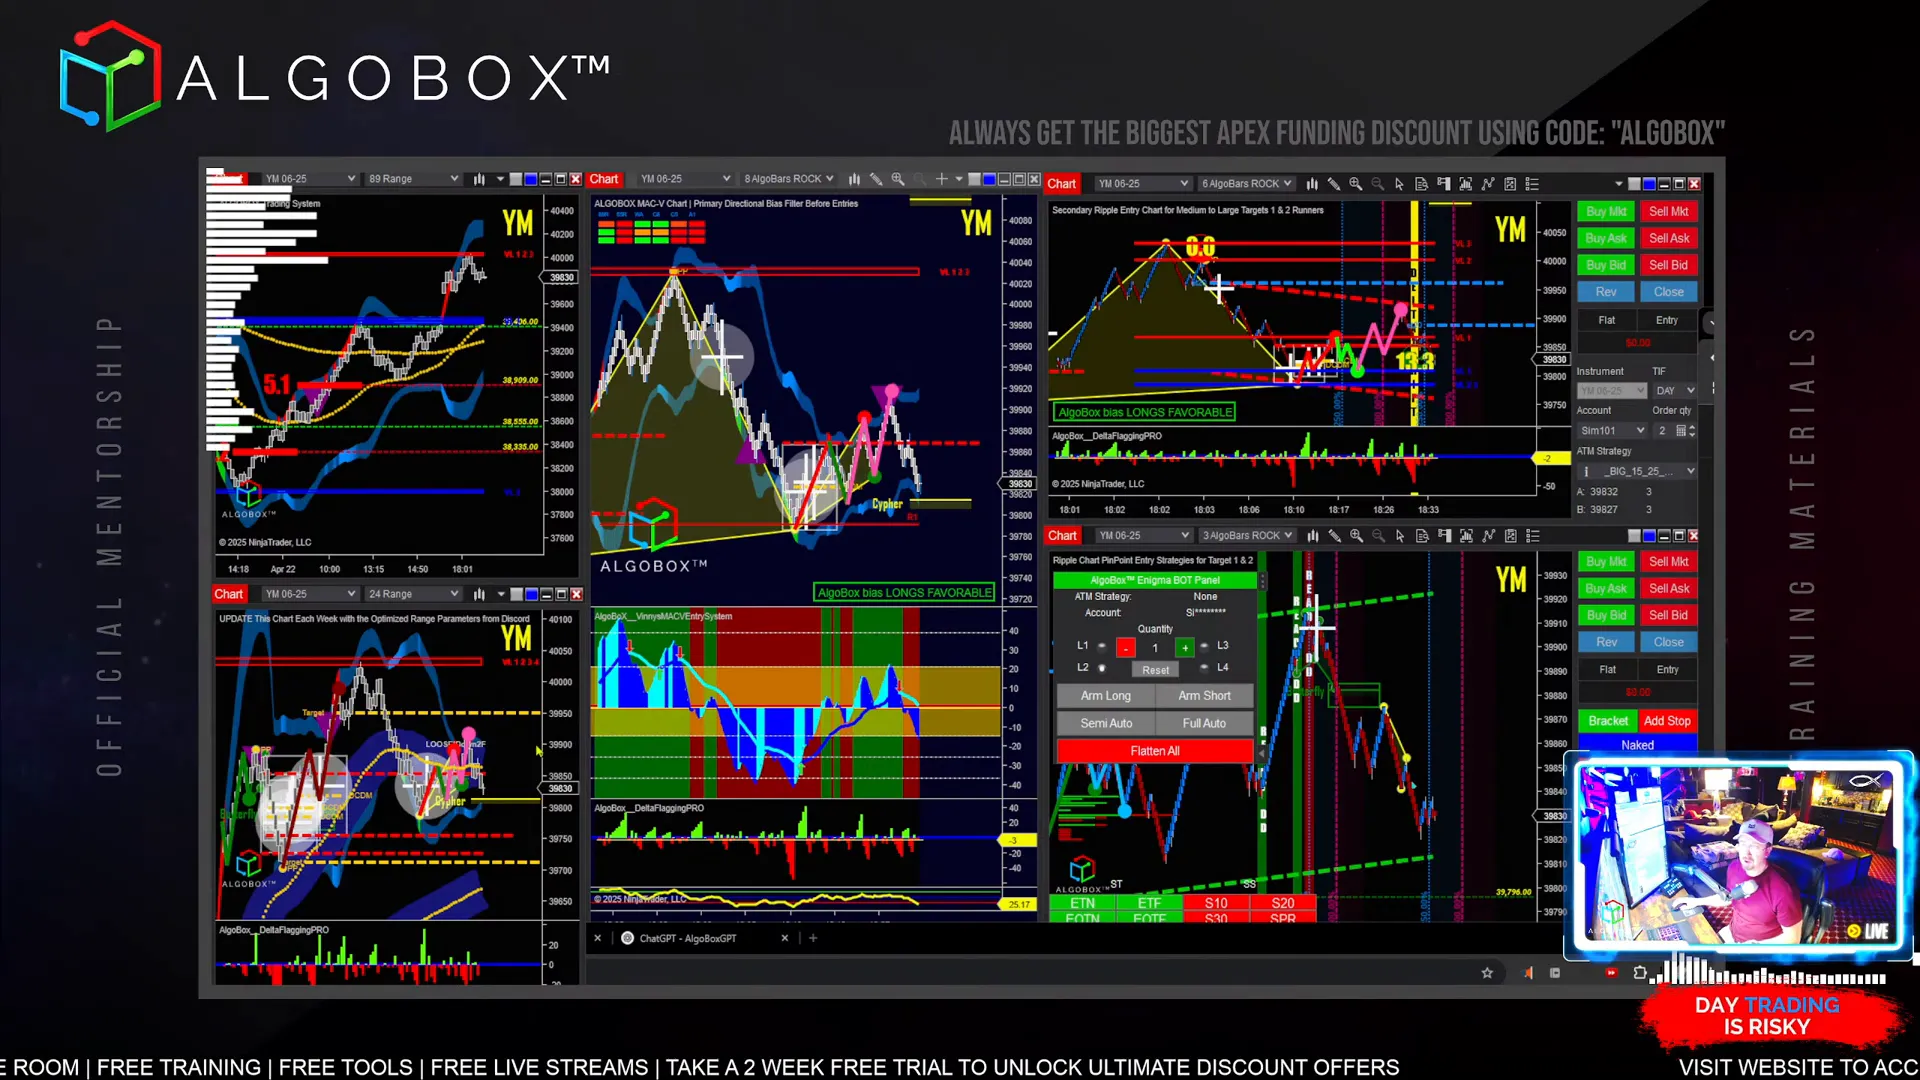
The Twenty-Chart Layout
This is my preferred comprehensive layout. It consists of 5 charts per instrument across 4 instruments, totaling 20 charts. Here’s how I arrange them:
- Bottom left quadrant: NASDAQ or your fastest instrument, positioned close to your execution buttons.
- Above NASDAQ: YM (Dow Futures), as I associate the letter “Y” with “Yes” and visualize nodding up and down.
- Right side: RTY (Russell 2000) and ES (S&P 500), with ES being the slowest and placed furthest right.
This layout ensures you always know where each instrument’s data is located, which is crucial for quick reactions.
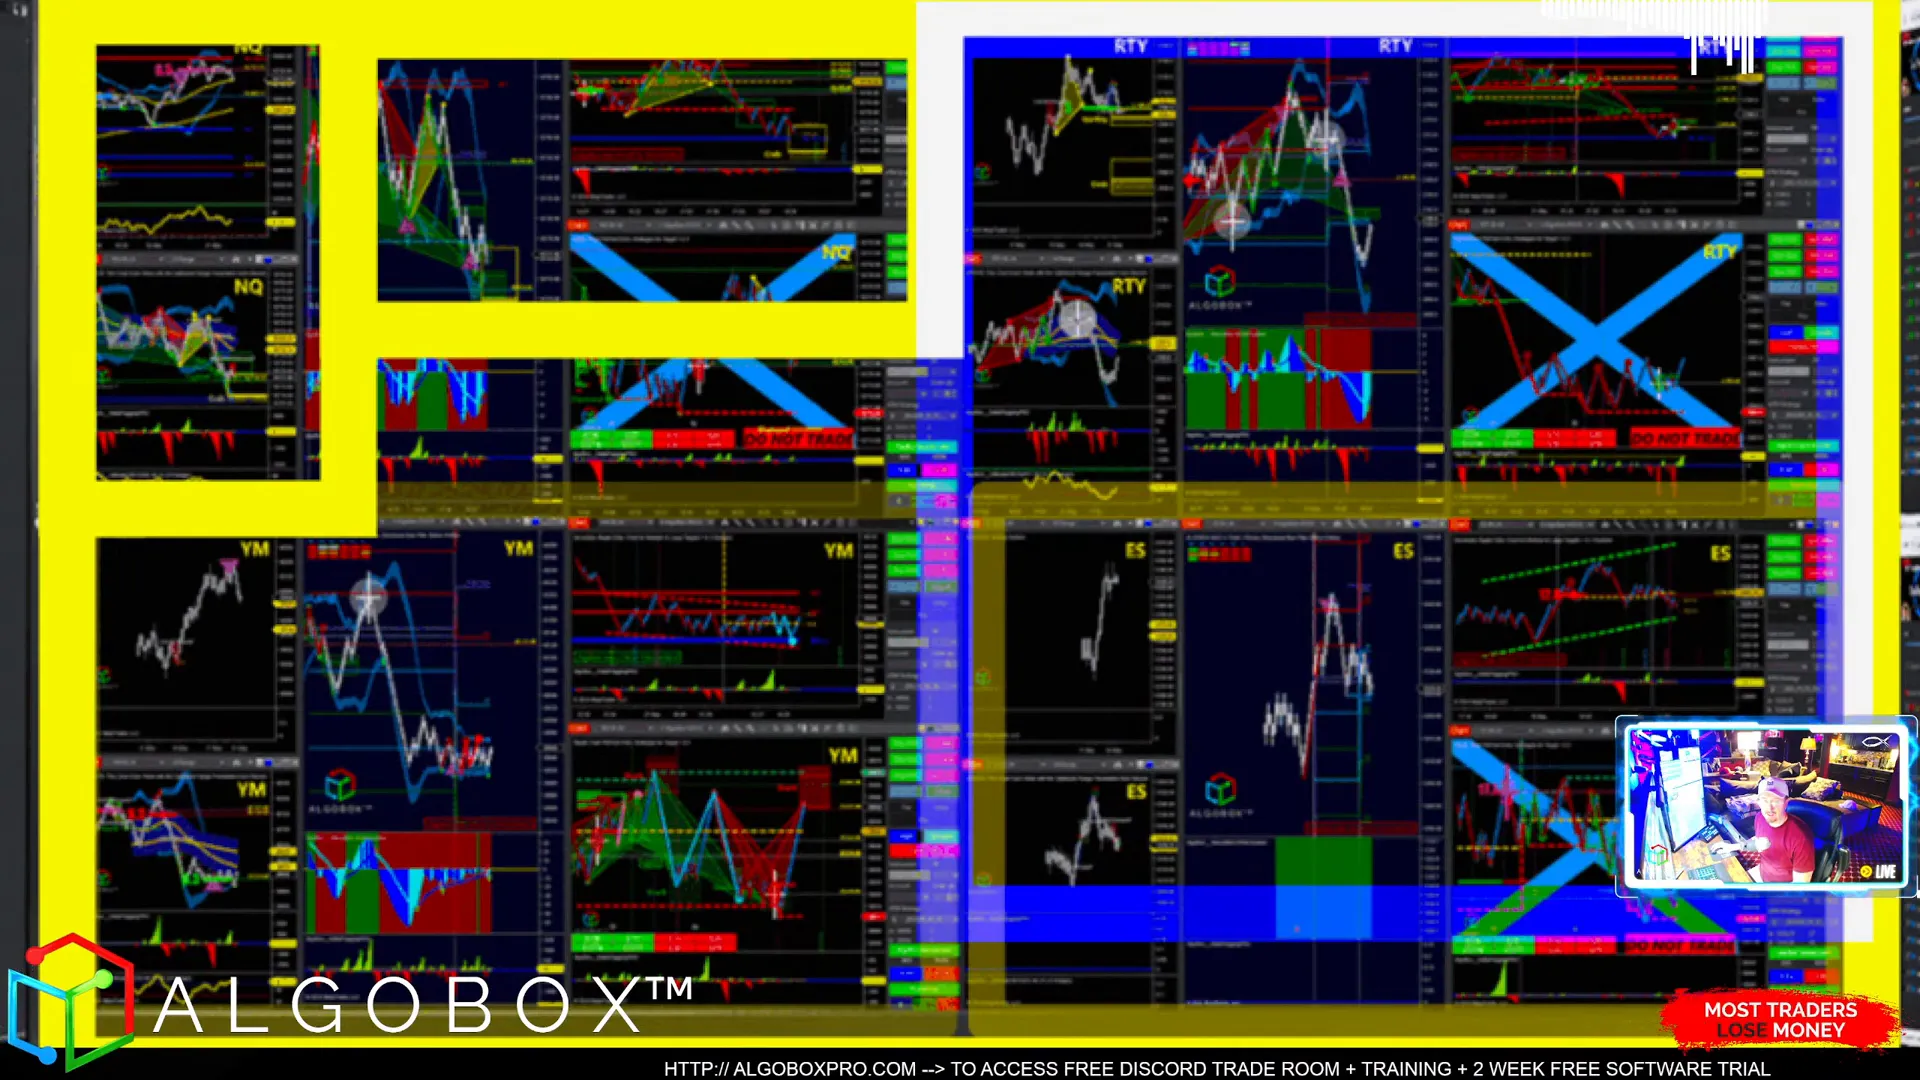
The Twelve-Chart Flag Layout
If you prefer a less overwhelming setup, the twelve-chart flag layout is an excellent alternative. It features three charts per instrument across four instruments. This layout helps focus on key data without cluttering your screen.
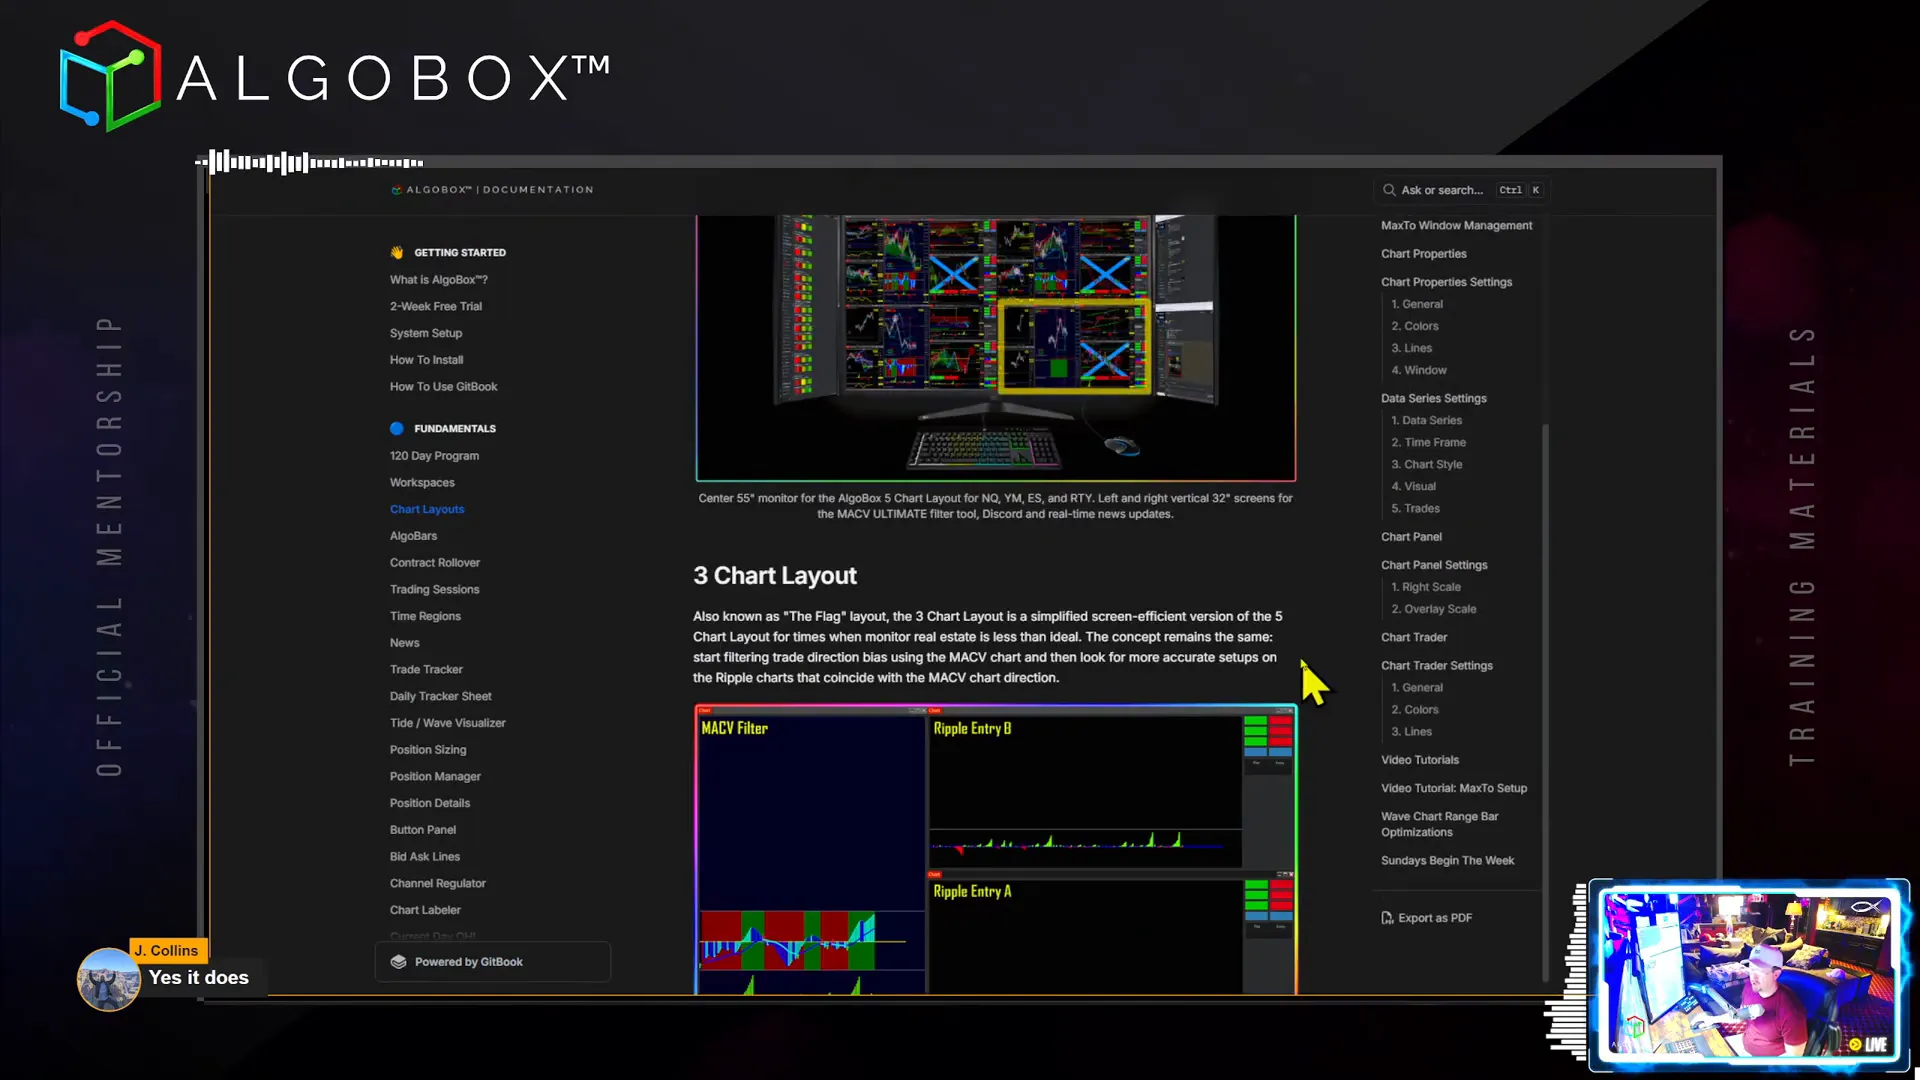
The Three-Chart Layout for Laptops
For traders using laptops or limited screen space, the three-chart layout is a practical choice. This layout removes some higher time frame charts, focusing on fewer but essential data points.
Keep in mind, the three-chart layout might limit your view during high volatility days, but it’s perfect for starting out or when your PC struggles with multiple charts.
Step 3: Chart Types and Their Roles
Understanding each chart type and its role in your trading system is critical. Here’s a breakdown of the primary chart types we use:
Tide Chart
The tide chart is the highest time frame chart in AlgoBox, typically an 89-tick range chart. This number is significant as it’s a Fibonacci number, which we use extensively for fractals and market pattern recognition.
Occasionally, on Nasdaq during extreme volatility, you might see a 144-tick chart used, but 89 is the standard.
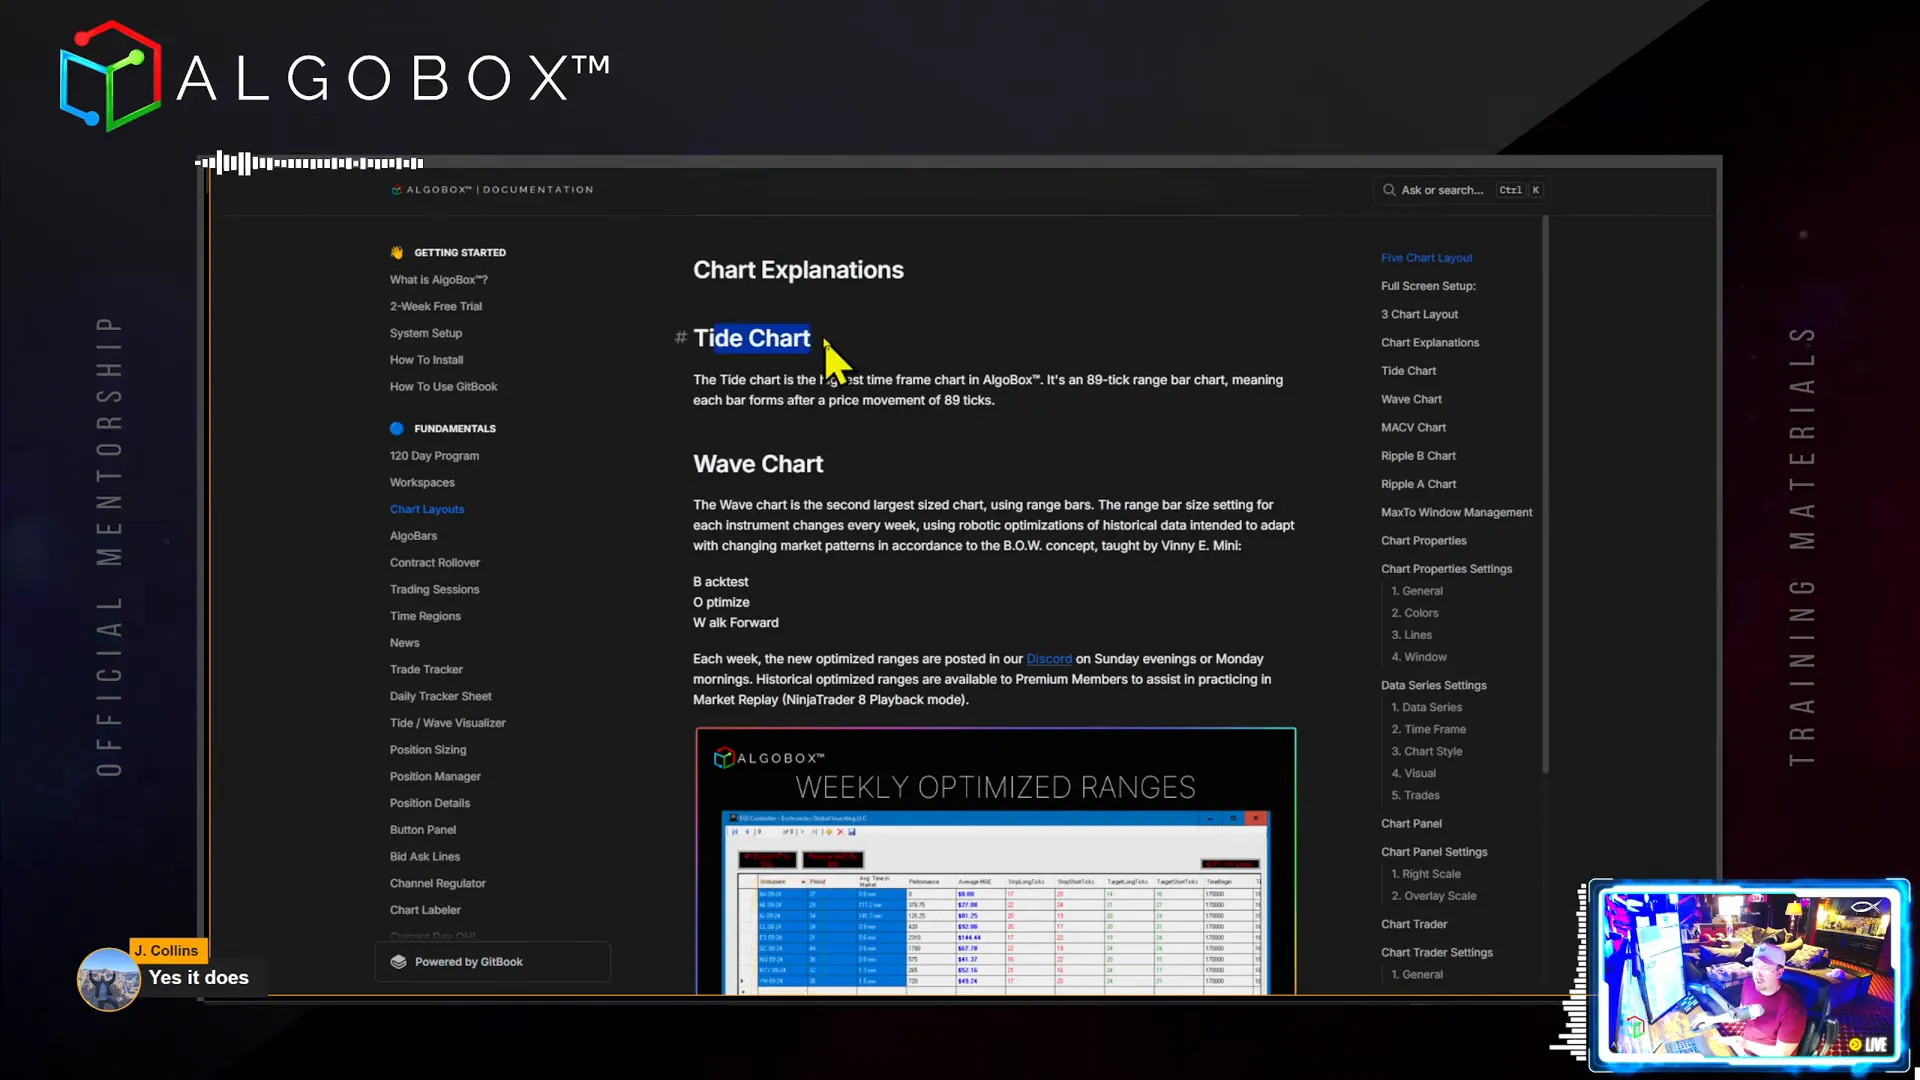
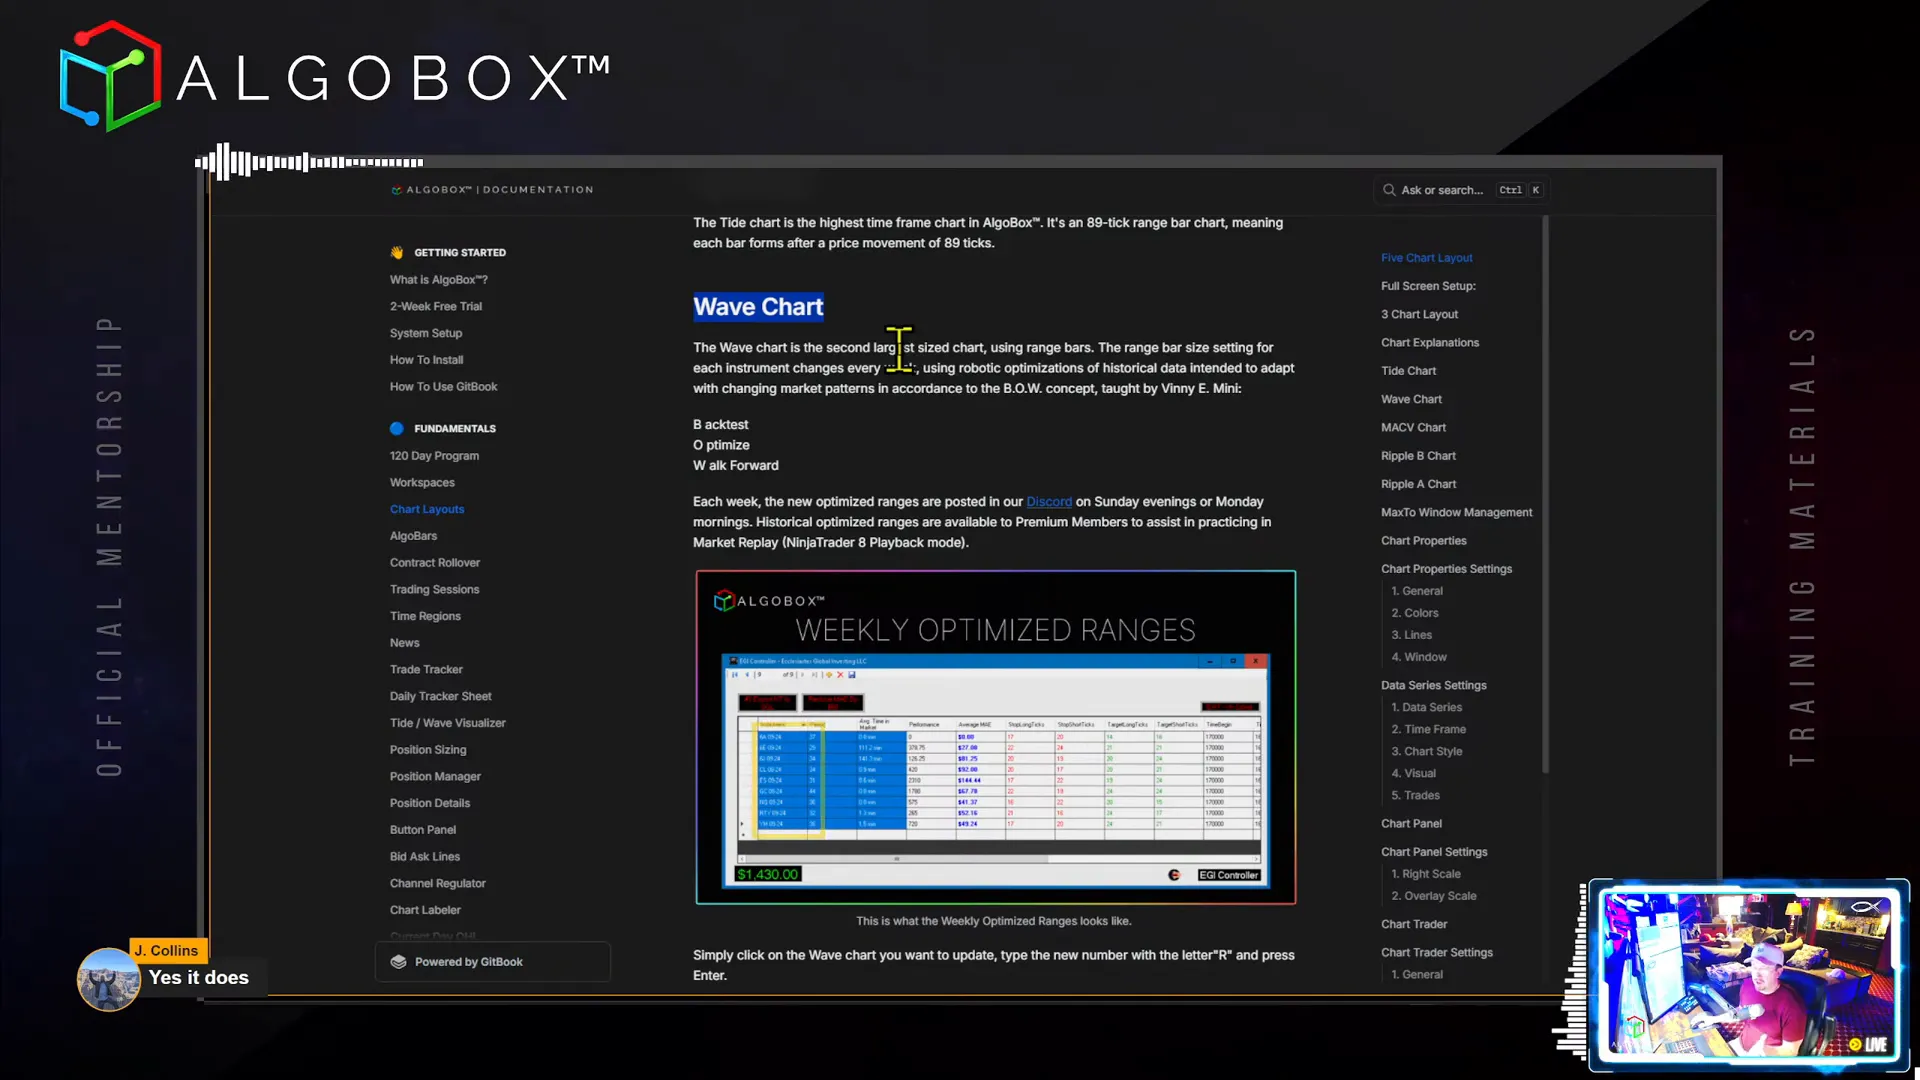
Wave Chart
The wave chart is the second largest chart and the only one that changes weekly. We run an optimization every week, posted on Sunday or Monday, to adjust the range bar size based on recent market data.
This chart is crucial because it adapts to current market conditions, helping you stay in tune with changing volatility and patterns.
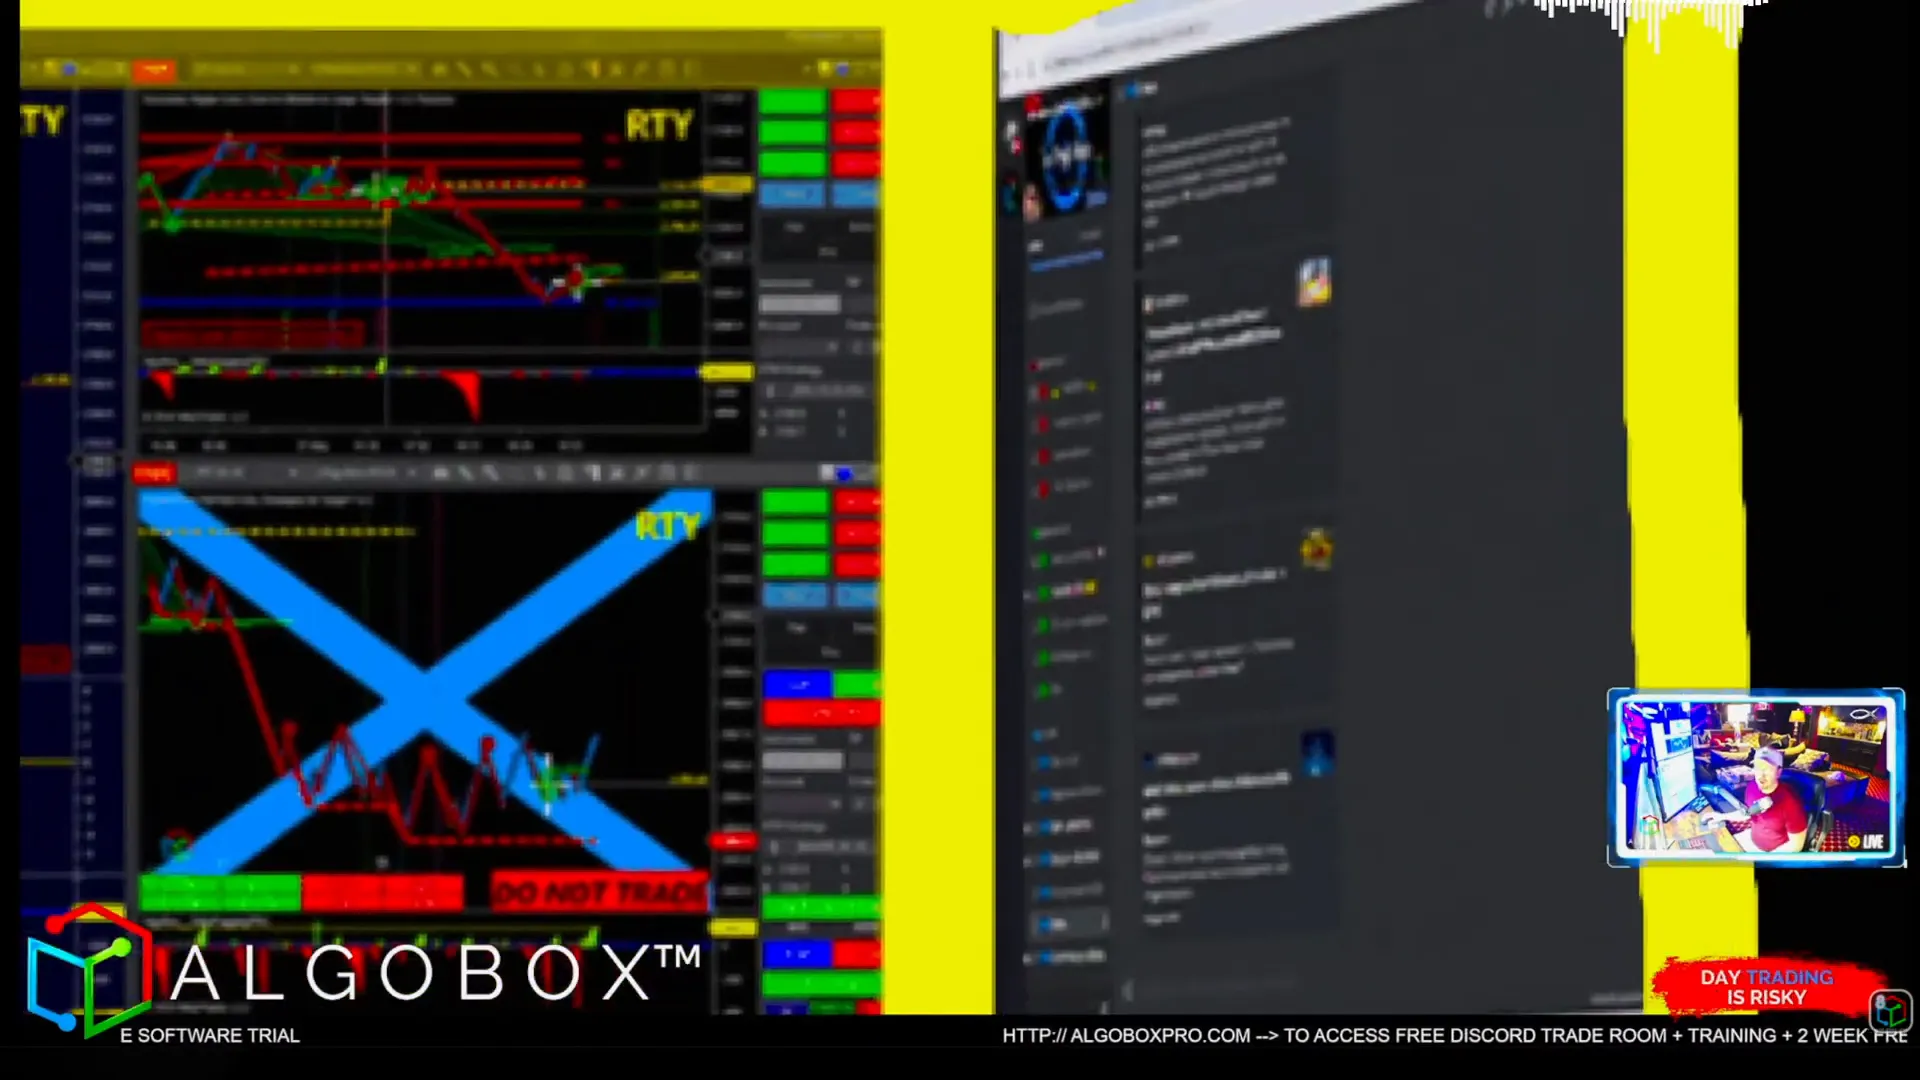
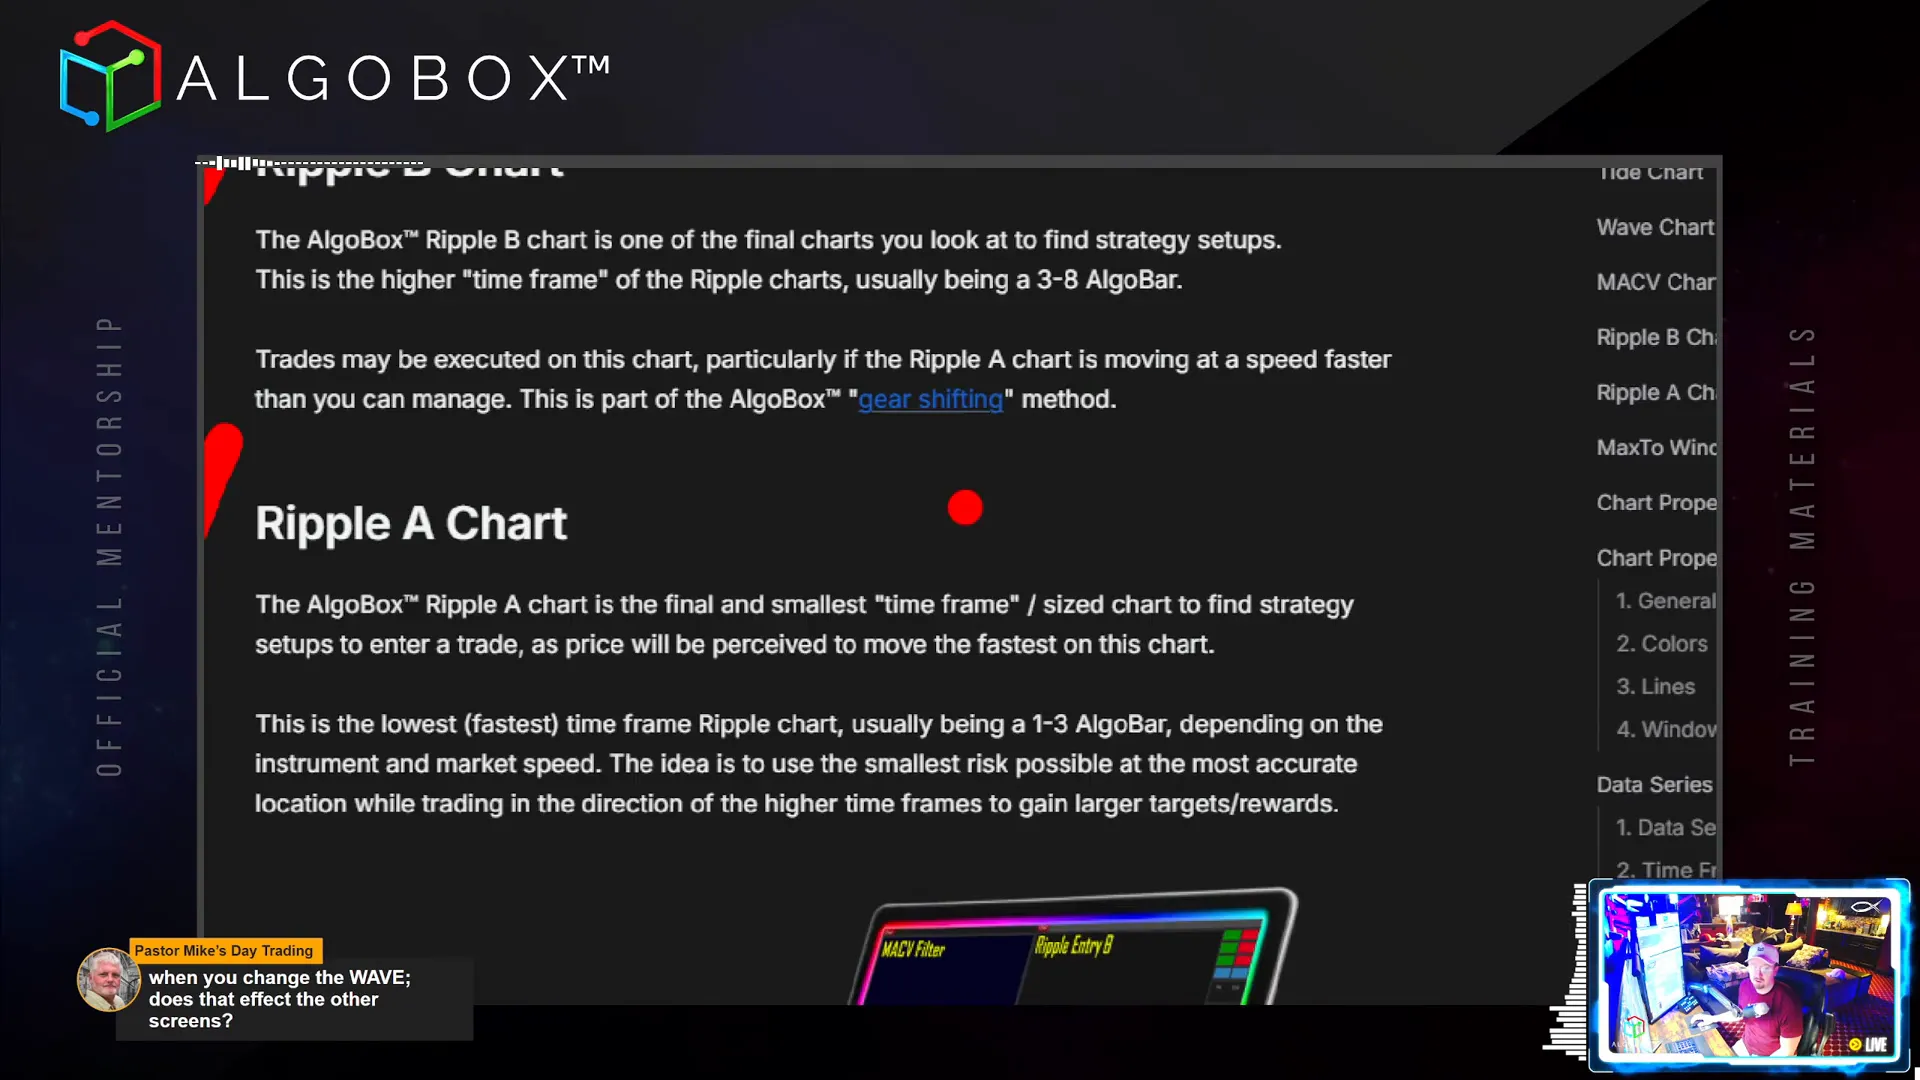
Ripple Charts (A and B)
Ripple charts are your primary entry charts, with Ripple A being the lowest risk and Ripple B the higher time frame of the two. Ripple A is where most of your entries occur, typically using 1-3 range bars depending on the instrument and market speed.
During high volatility, these bar sizes may increase. For example, Nasdaq recently required larger bar sizes due to extreme market speed.
Step 4: Optimizing Your Charts for Market Conditions
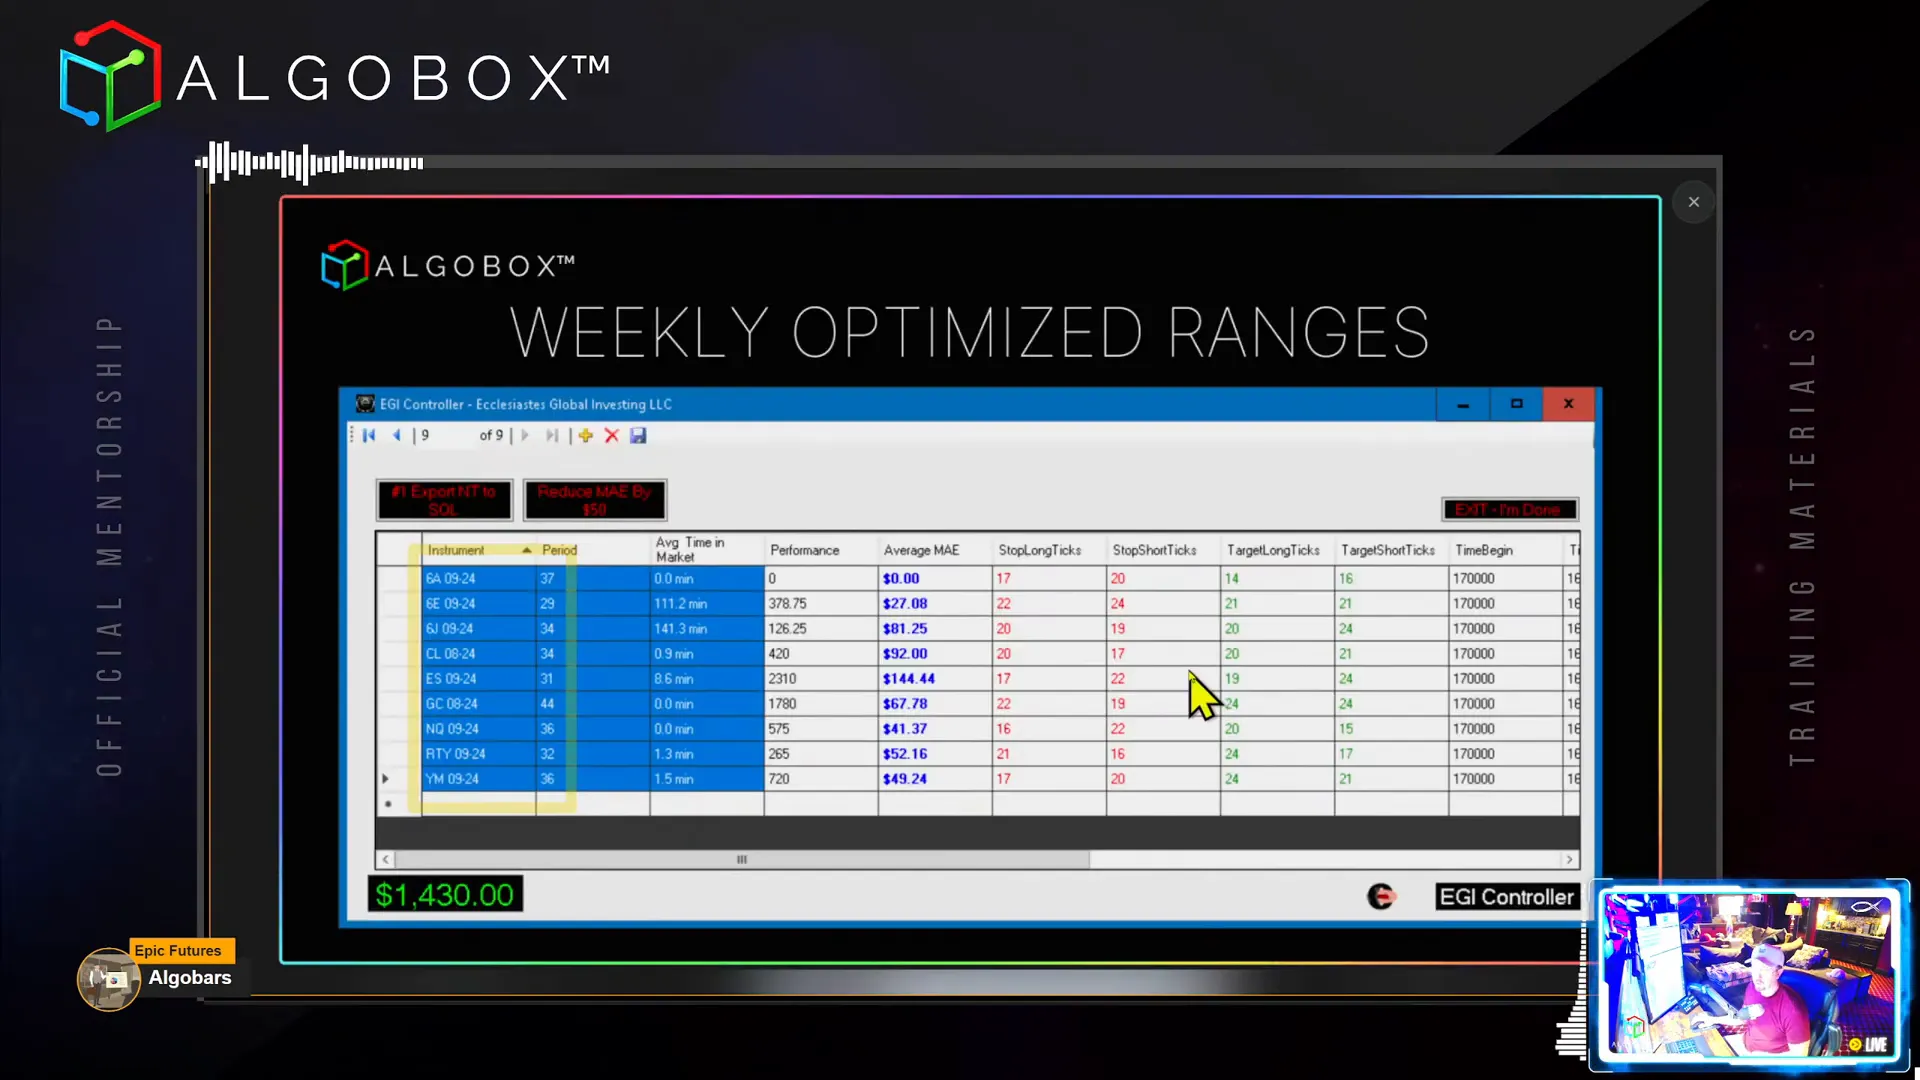
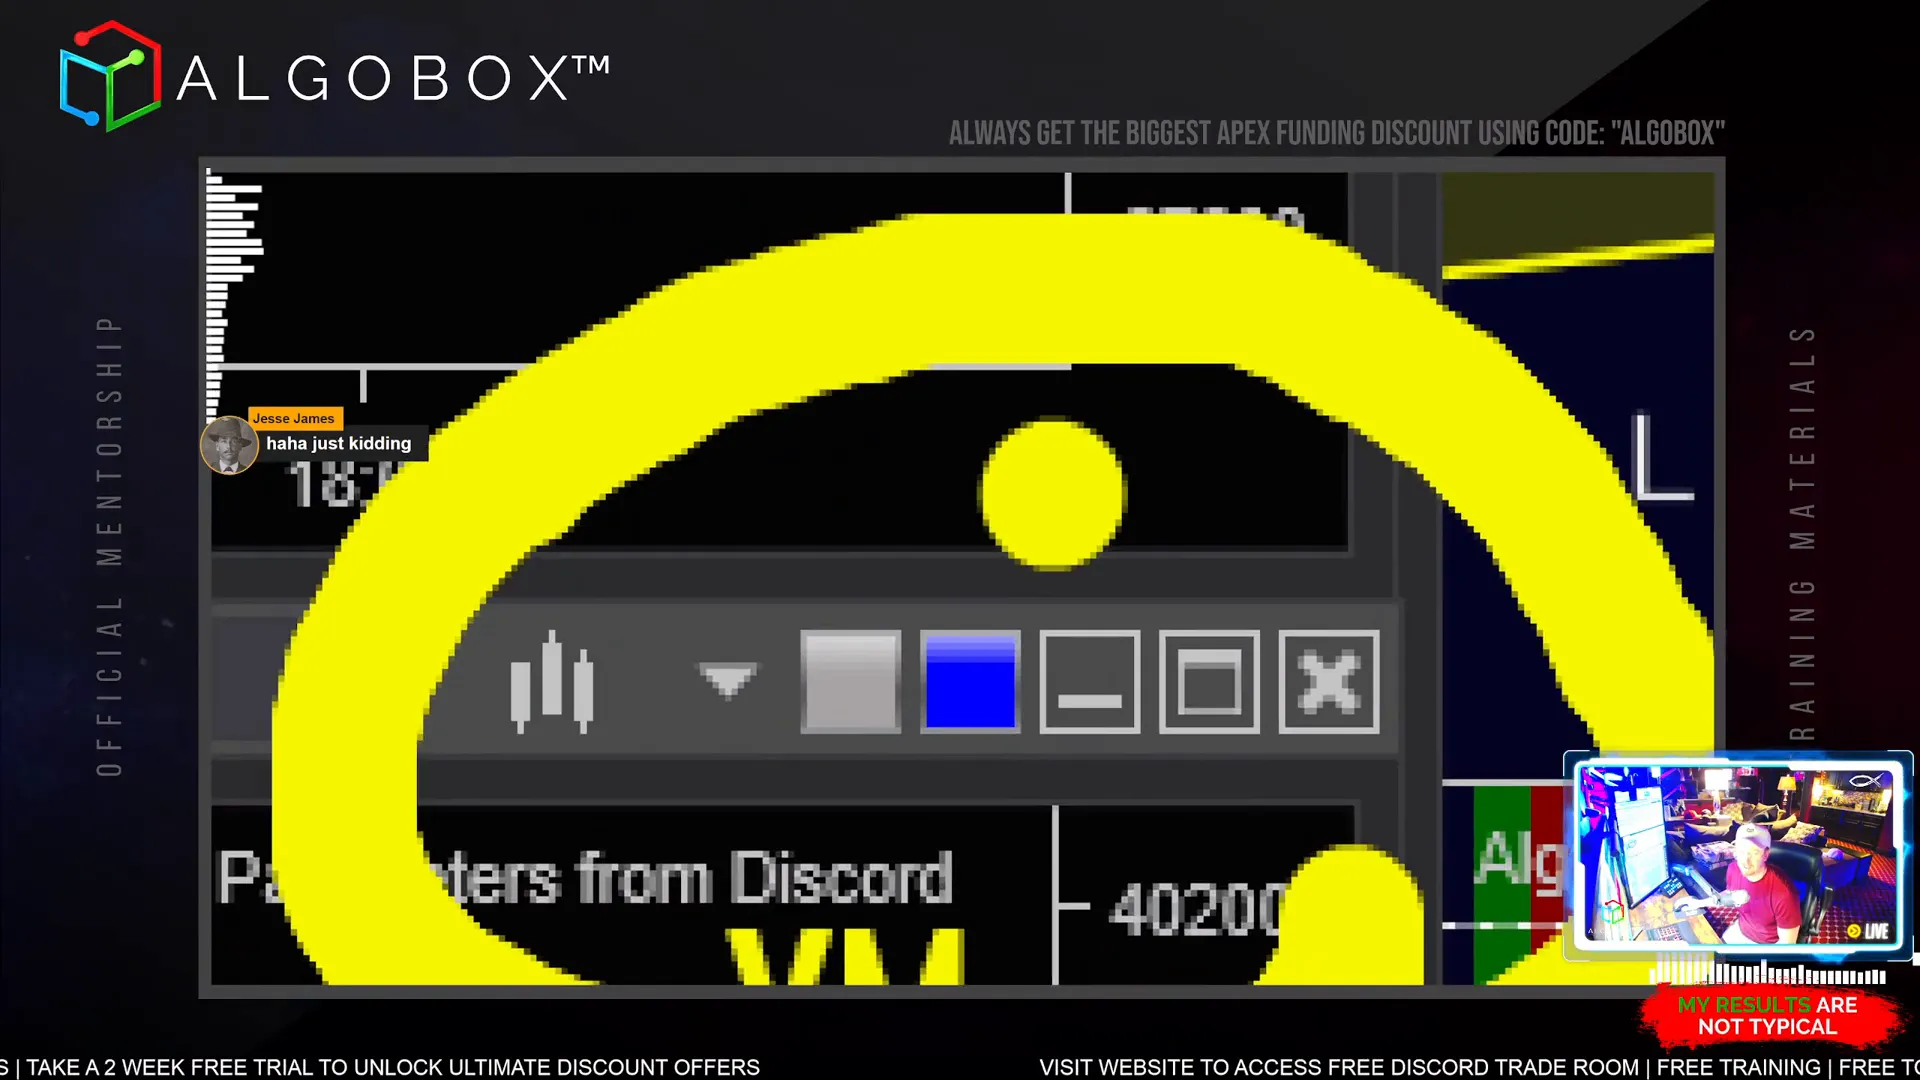
Optimization is key to maintaining effective trading charts. Each week, we provide optimized range settings for your wave charts, which you need to input manually into NinjaTrader.
Here’s how to do it:
- Click anywhere on your wave chart to select it.
- Type the new range number followed by the letter ‘r’ (for range), e.g., “36r”.
- Press Enter. The chart will recalculate and display the new range size.
- Repeat for each instrument you trade.
This process keeps your charts tuned to the current market environment, improving trade accuracy and timing.
Alpha Omega Crosses and Continuous Optimization
Along with the wave chart, the Alpha Omega (AO) crosses are important indicators that remain on a static optimized range throughout the week but can be adjusted if major events impact market volatility.
AlgoBox continuously optimizes every four minutes throughout the trading day, ensuring you have the most accurate data possible.
Step 5: Gear Shifting and Bar Size Adjustments
Markets can become extremely volatile, requiring you to adjust your bar sizes and even switch instruments to maintain control and reduce risk. This is where the concept of gear shifting comes in.
Think of your bar sizes like gears in a car:
- Gear 1: Smallest bar size (e.g., 1 range bar), used in calm markets.
- Gear 2-4: Increasing bar sizes for faster, more volatile markets.
When the market gets too fast, especially with instruments like Nasdaq (NQ), you might switch to a slower instrument like YM (Dow) or RTY (Russell 2000) or increase your bar size to maintain manageable risk.

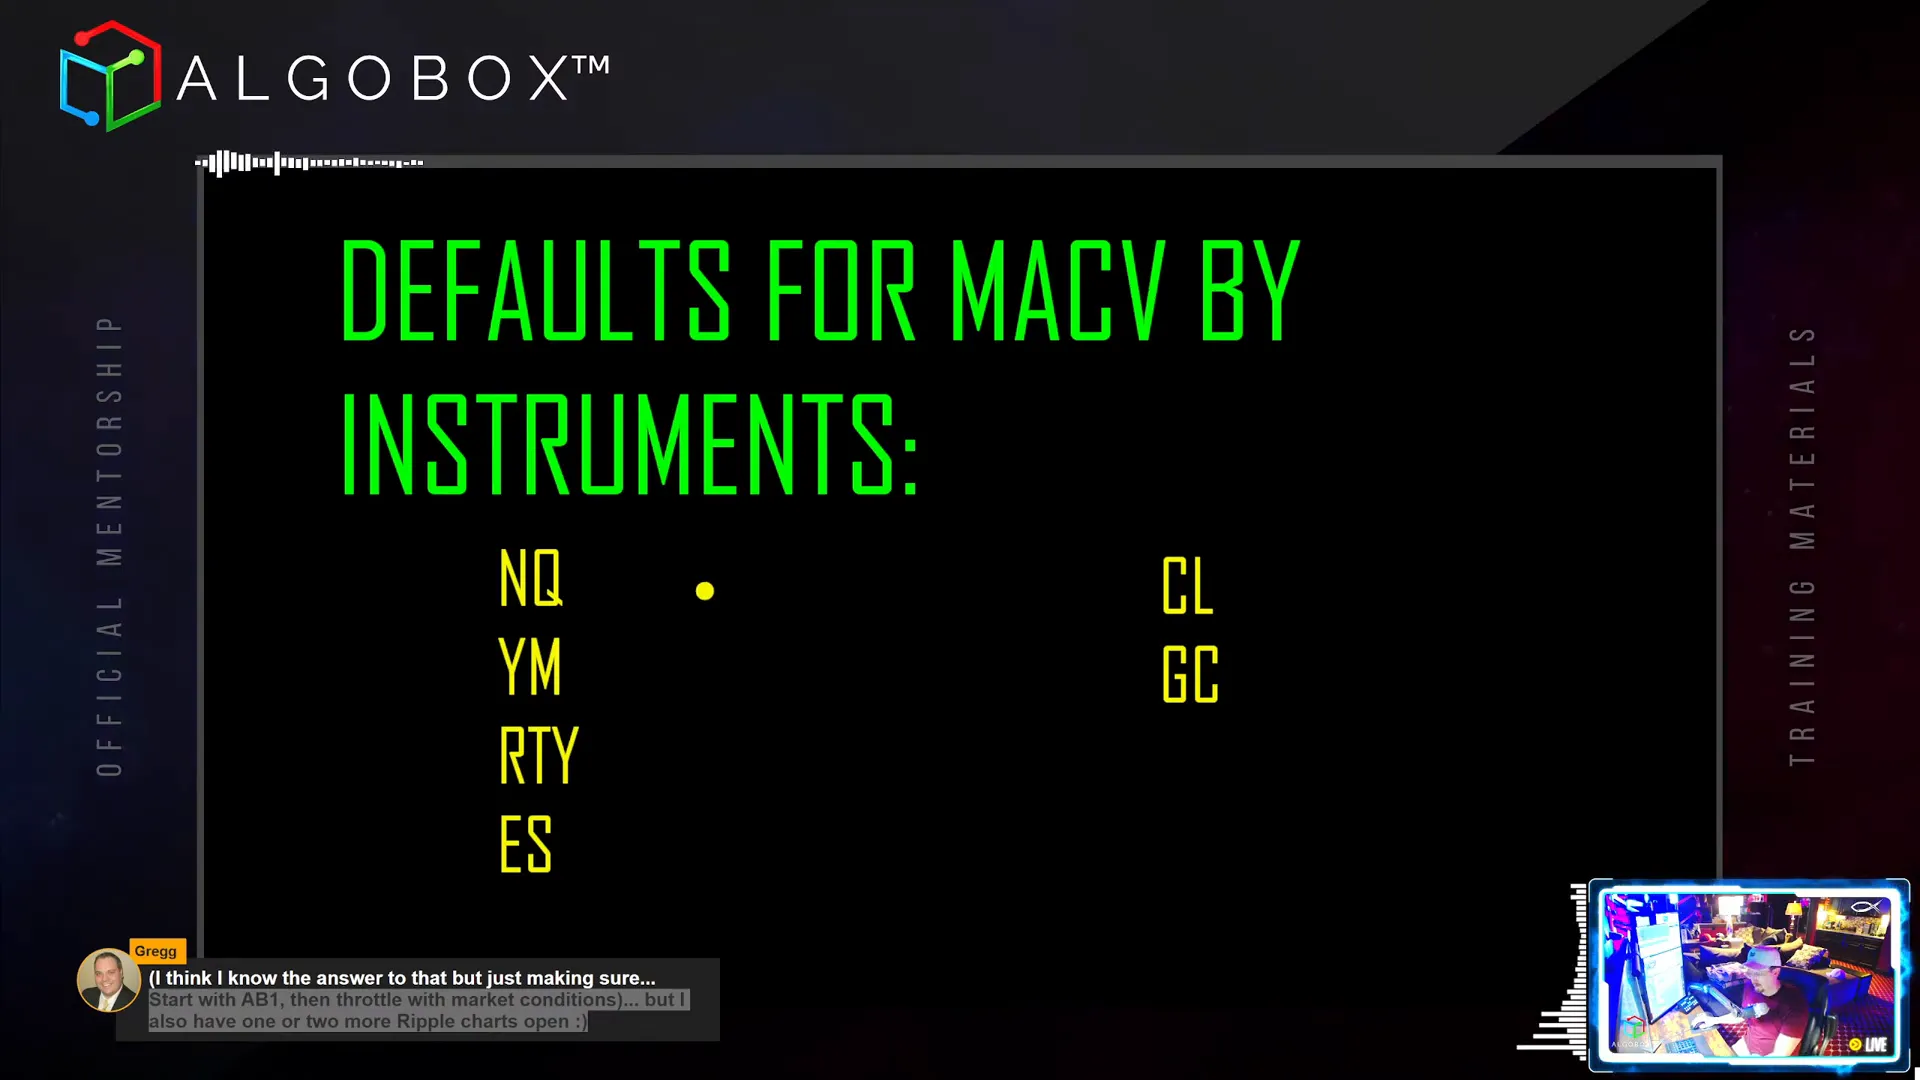
Default Algo Bar Settings by Instrument
Here are general guidelines for default AlgoBar settings per instrument:
- Nasdaq (NQ): AB 9 (sometimes 8 is too small)
- YM (Dow): AB 7
- RTY (Russell 2000): AB 7
- ES (S&P 500): AB 6
- Crude Oil: AB 7
- Gold: AB 7
Adjust these settings based on market speed and your personal risk tolerance.
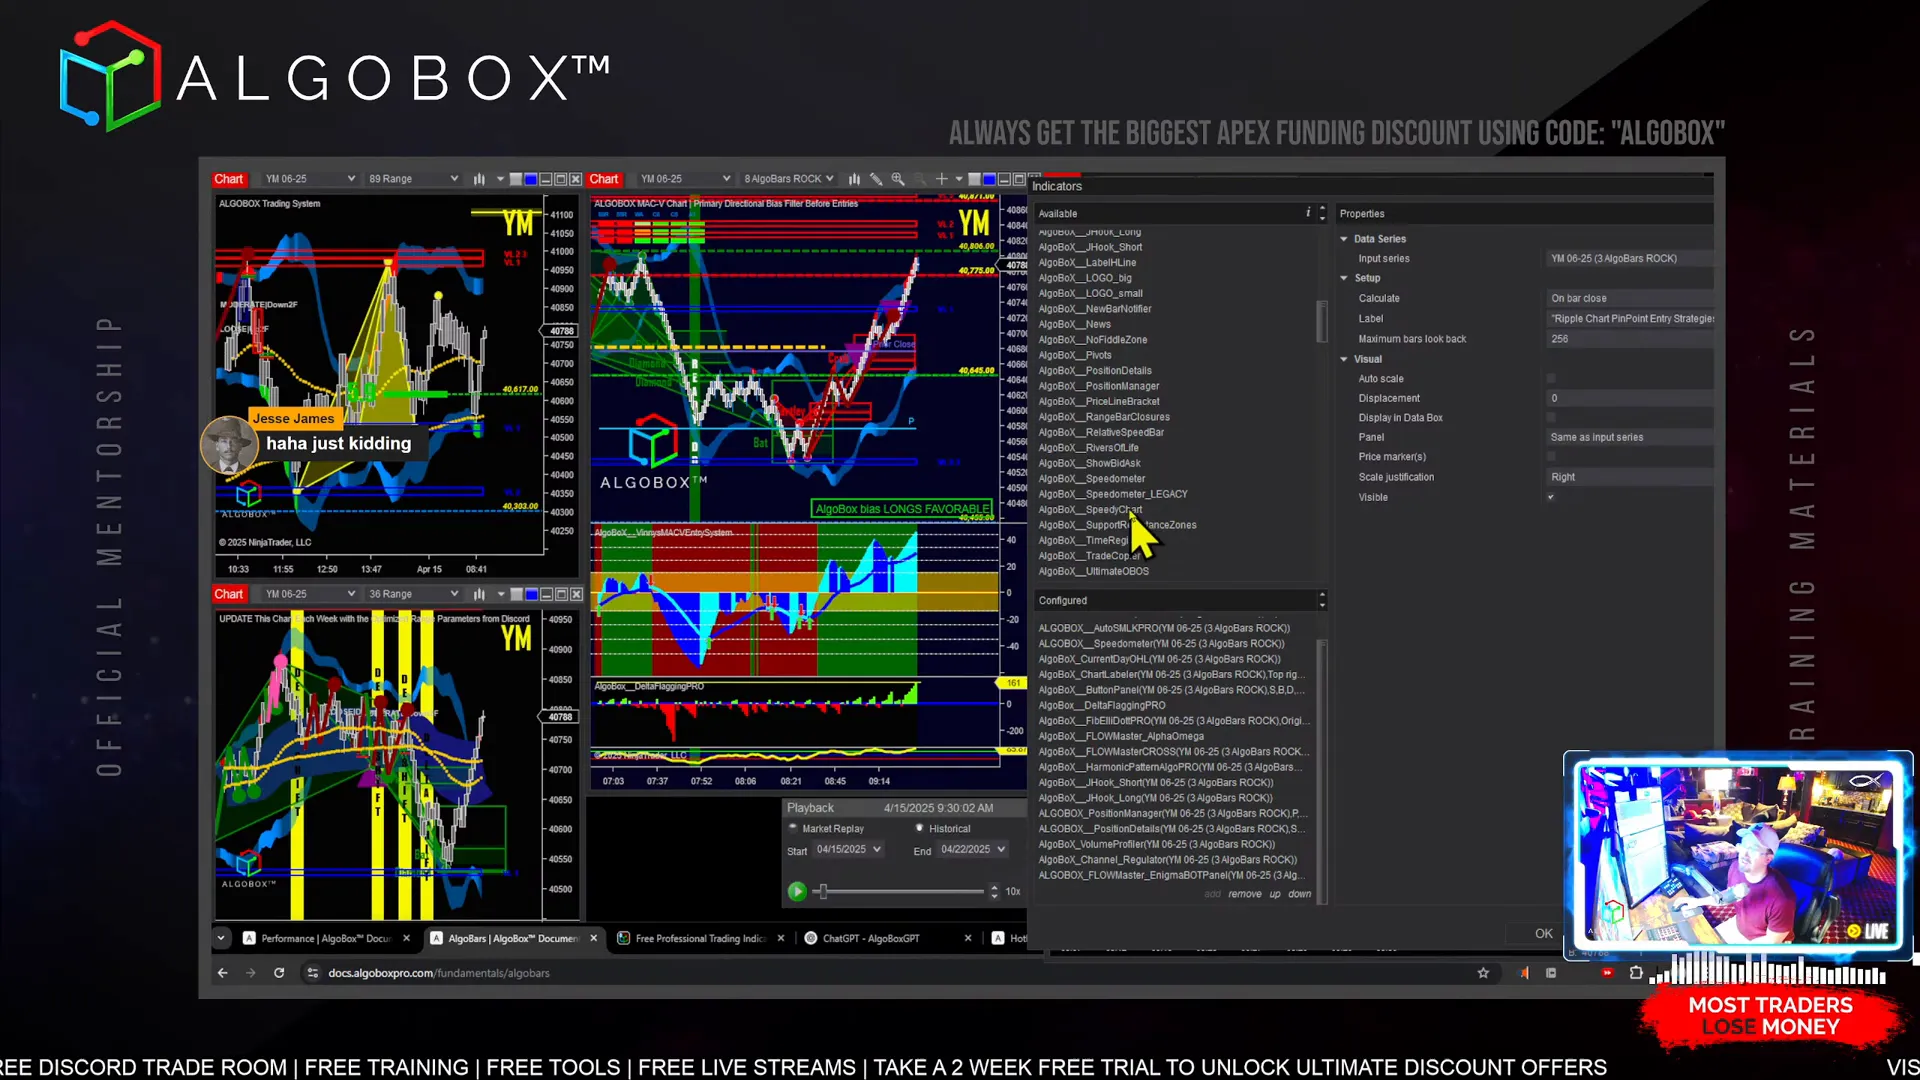
Step 6: NinjaTrader Interface Basics for AlgoBox
Knowing how to navigate NinjaTrader’s interface efficiently will enhance your trading experience. Here are some key points:
Linking Charts
Use the color linking feature to synchronize multiple charts. For example, if you change the instrument on one chart, all linked charts will update automatically.
To link charts:
- Look for the colored square in the top right corner of the chart.
- Assign the same color to all charts you want to link.
- Right-click to change the instrument on one chart, and all linked charts will update.
You can unlink charts by assigning different colors or no color.
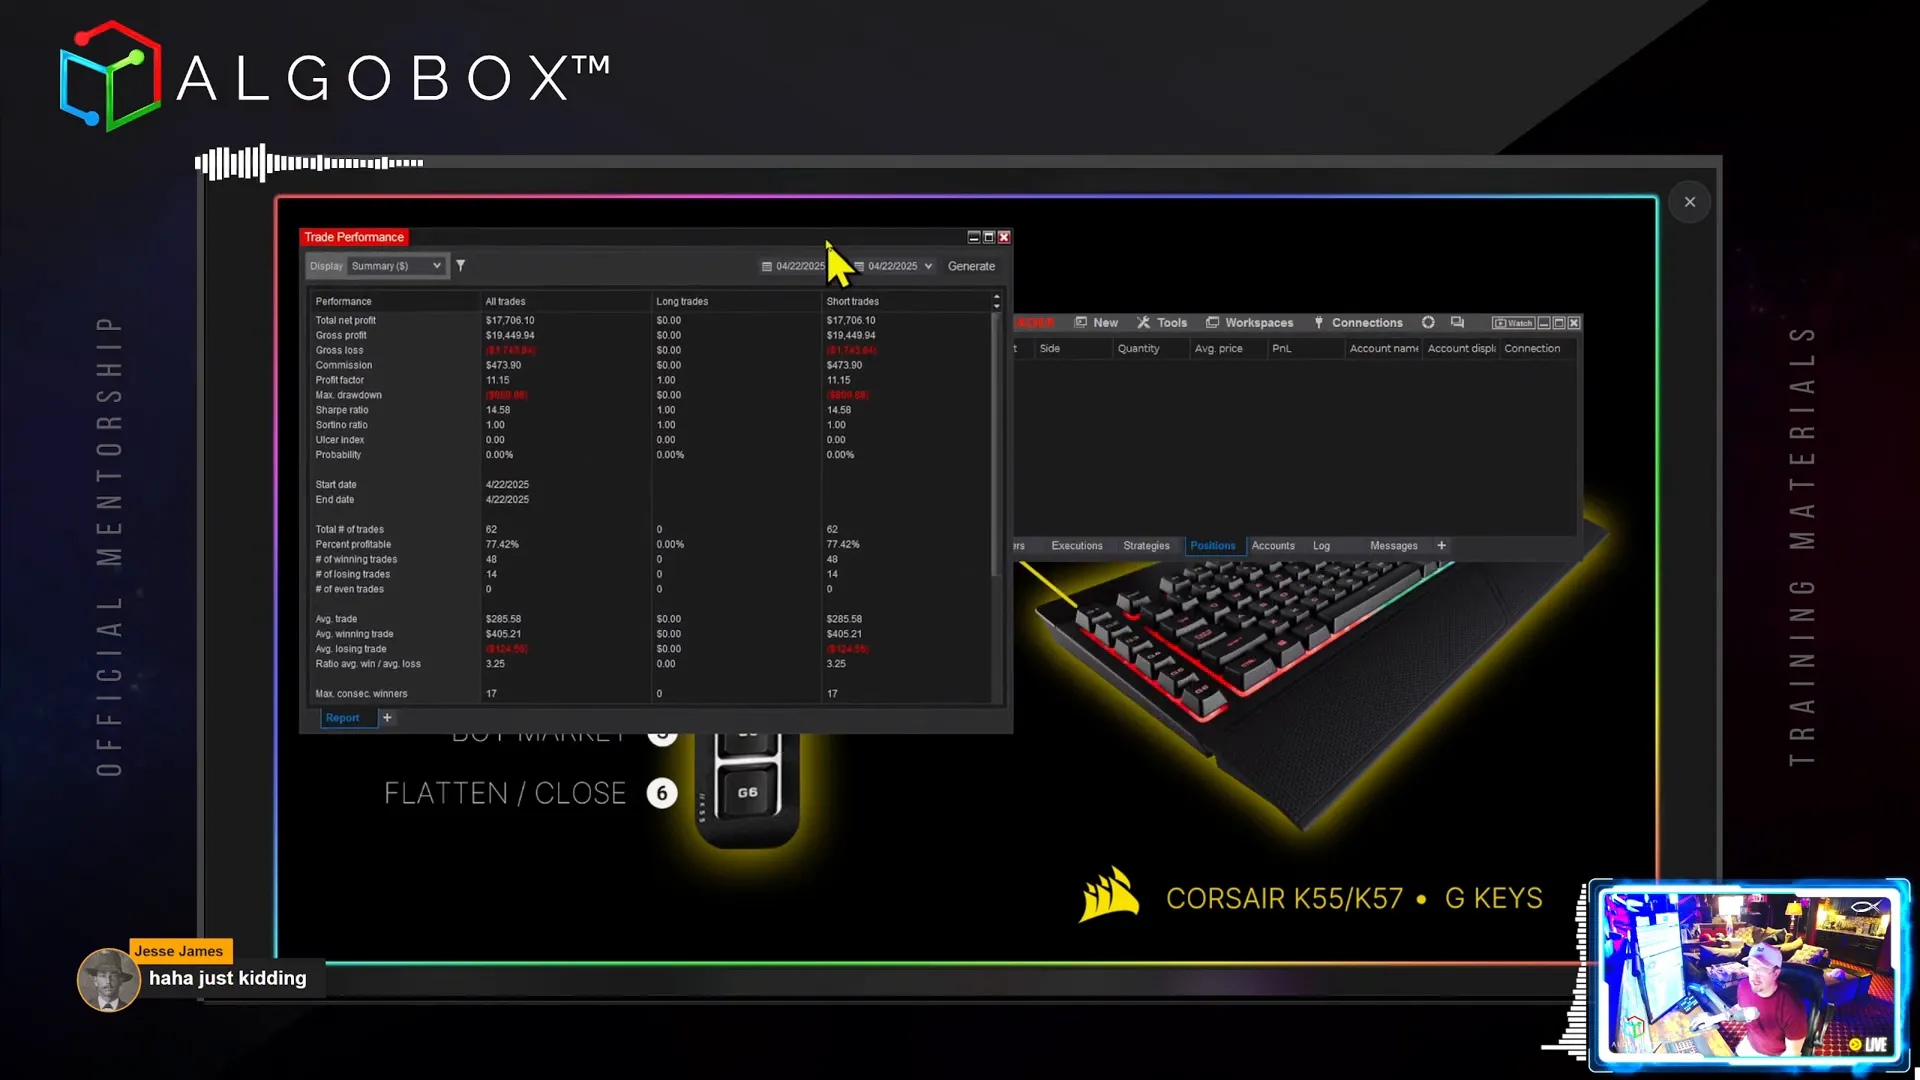
Performance Charts and Tracking
Track your trading performance by opening the Trade Performance window from the NinjaTrader Control Center under “New”. This helps you monitor:
- Profitability percentage
- Profit factor
- Growth over time
- Trade statistics such as win/loss ratios and average ticks gained
Regularly clearing your NinjaTrader database can help maintain performance and speed.
Step 7: Market Replay and Playback Practice
Market Replay is a powerful tool that allows you to practice trading using historical data. This is invaluable for mastering strategies without risking real money.
To use Market Replay:
- Disconnect your live data feed.
- Select “Playback” connection in NinjaTrader.
- Choose the date and time to start your replay.
- Right-click and select “Go To” to jump to a specific time (e.g., 9 AM).
- Press play and adjust playback speed (up to 30x) to maximize practice time.
Adjust your Windows volume mixer to control the sound levels of NinjaTrader playback without affecting other applications.
Speedy Chart Indicator for Smoother Replay
Add the Speedy Chart indicator to your charts during replay sessions to smooth out choppy data and improve visual clarity.
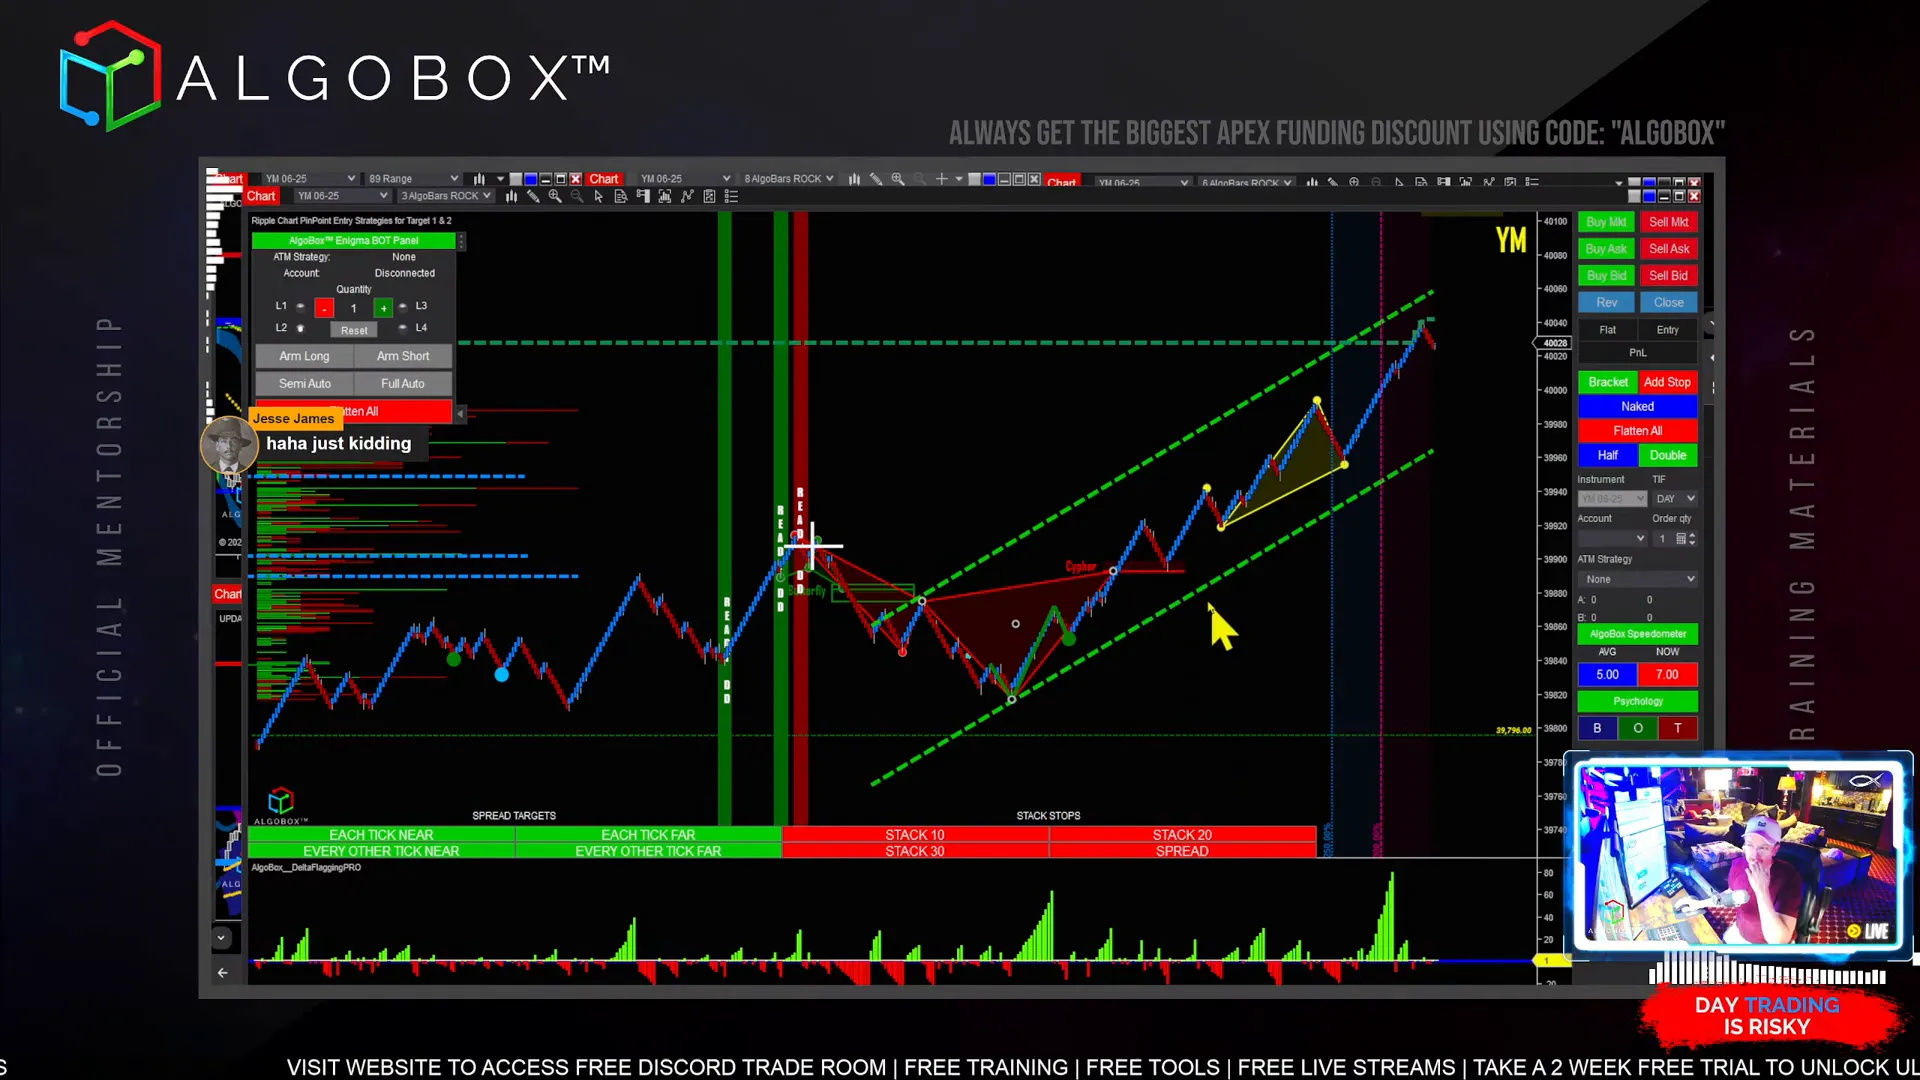
Step 8: Hot Keys and Chart Controls
Hot keys are essential for efficient trading, allowing you to execute orders and adjust charts quickly without using a mouse.
Recommended hot key uses include:
- Order entry (buy/sell)
- Position sizing (half, double positions)
- Chart zoom (Control + Up/Down)
- Toggle execution panels
Bind hot keys to keys that are easily accessible on your keyboard or mouse for rapid execution.
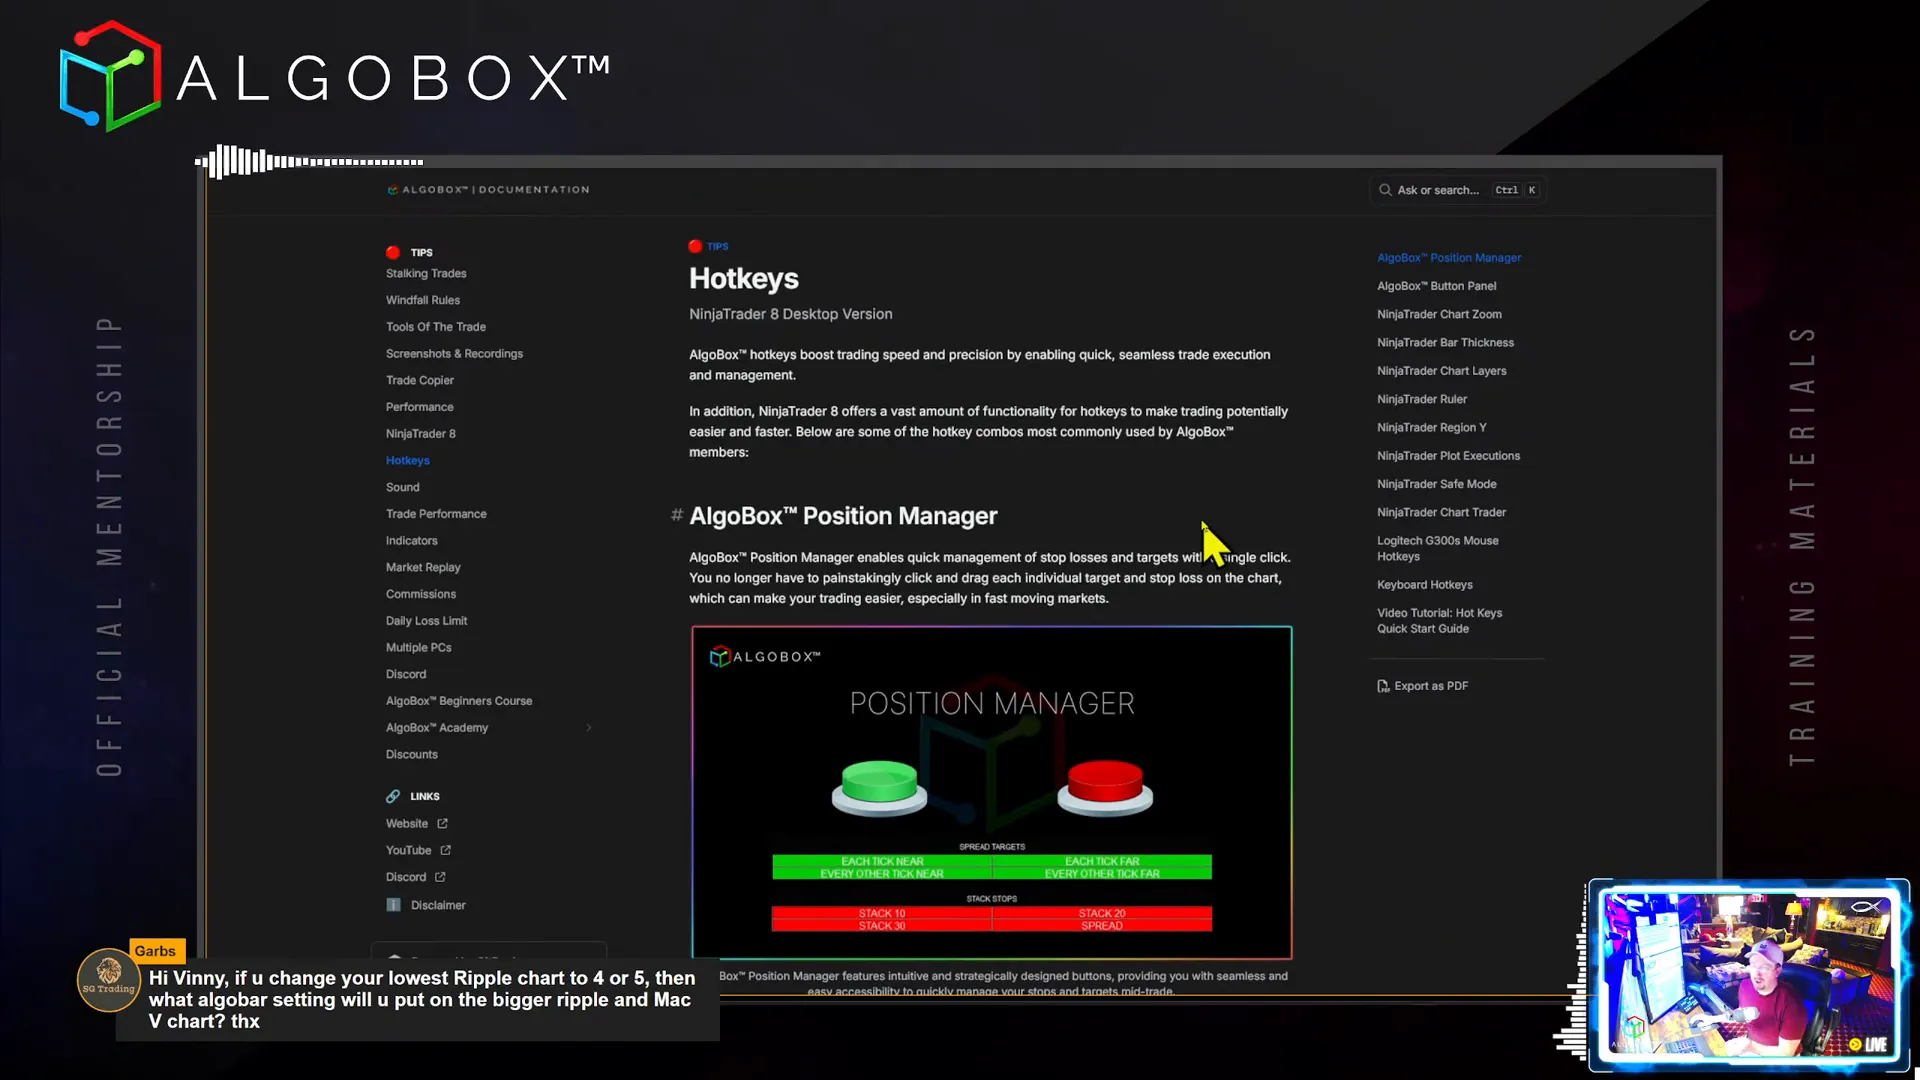
Chart Zoom and Bar Thickness
Use Control + Up/Down to zoom charts and Alt + Up/Down to adjust bar thickness. Proper zoom and bar size help you see enough data context without overcrowding your screen.
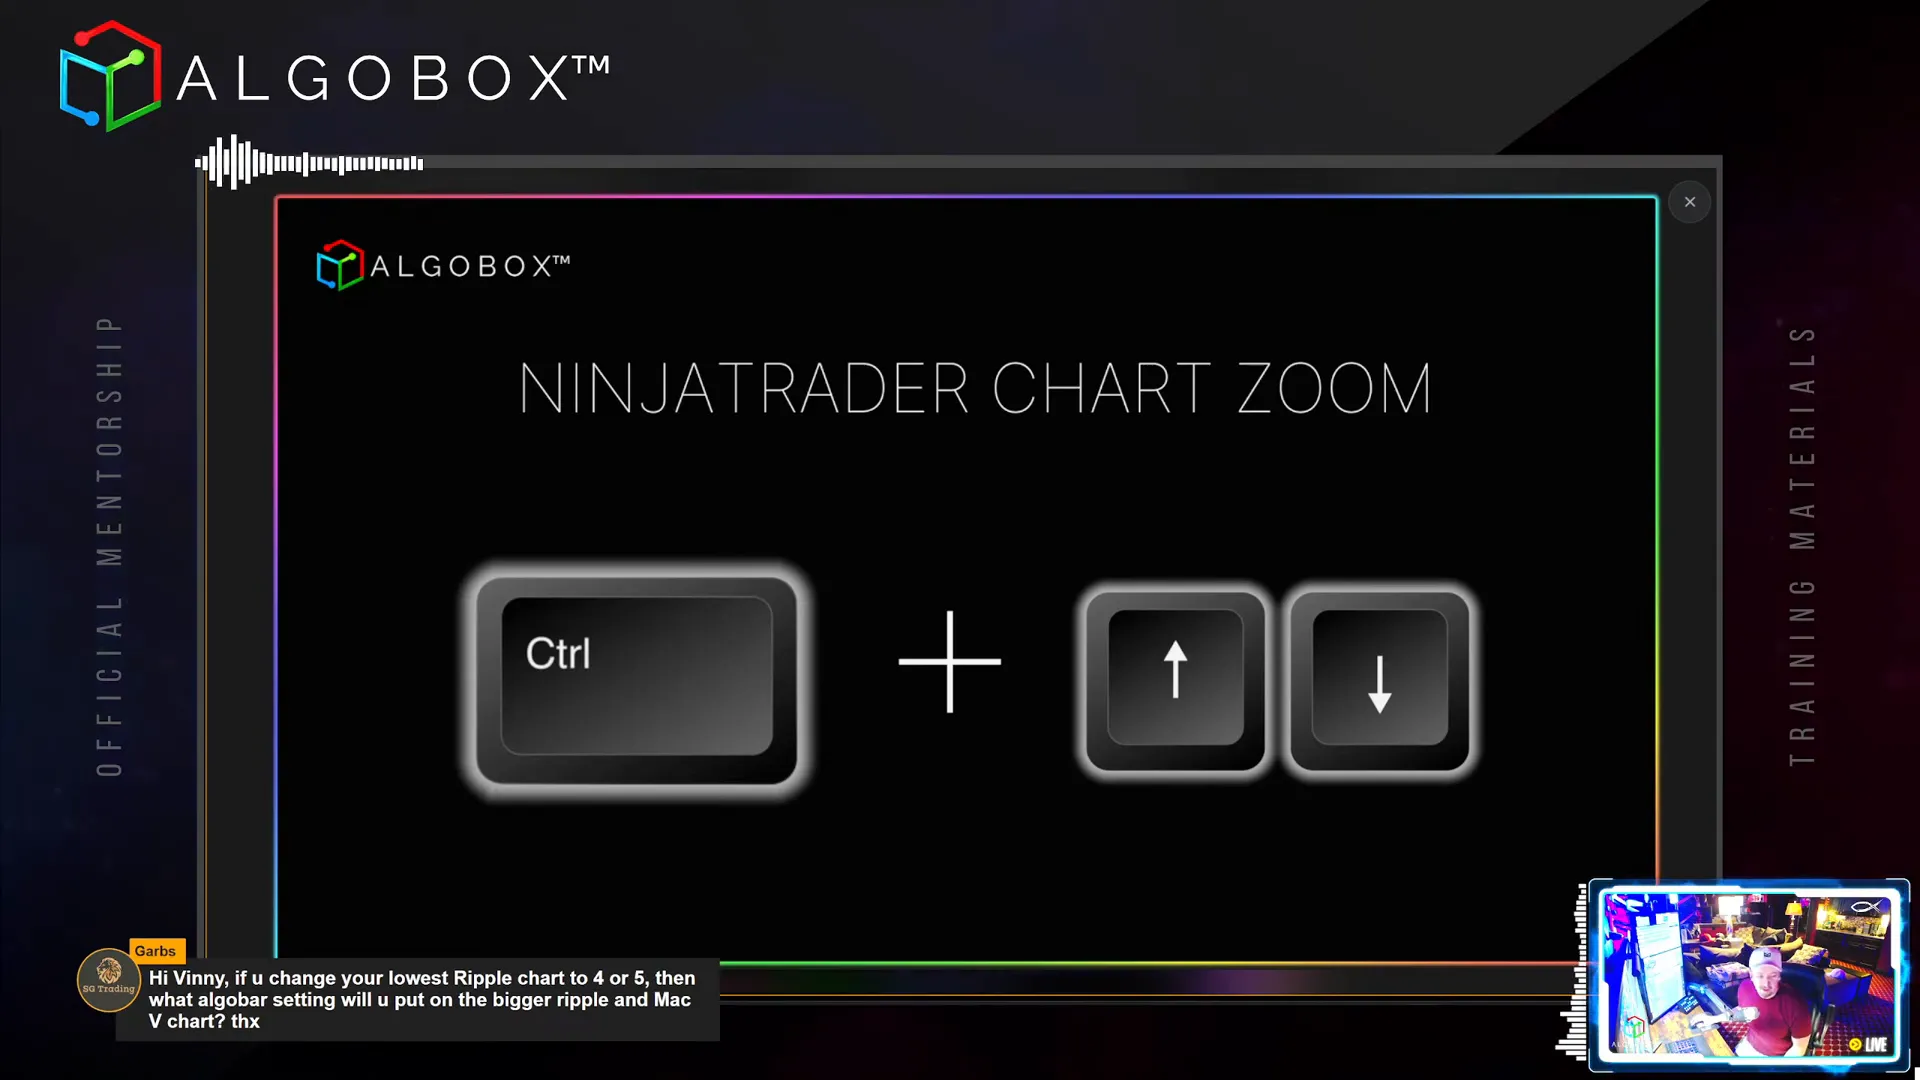
Chart Layers and Object Management
Manage chart layers by selecting objects and using Shift + Mouse Wheel to bring items forward or send them backward. This is helpful to highlight important patterns like harmonics or entry signals.
Step 9: Practical Tips and Community Resources
Here are some additional tips to enhance your AlgoBox trading experience:
- Use Discord wisely: Avoid direct messages to prevent scams. Use public and premium member chats for questions and updates.
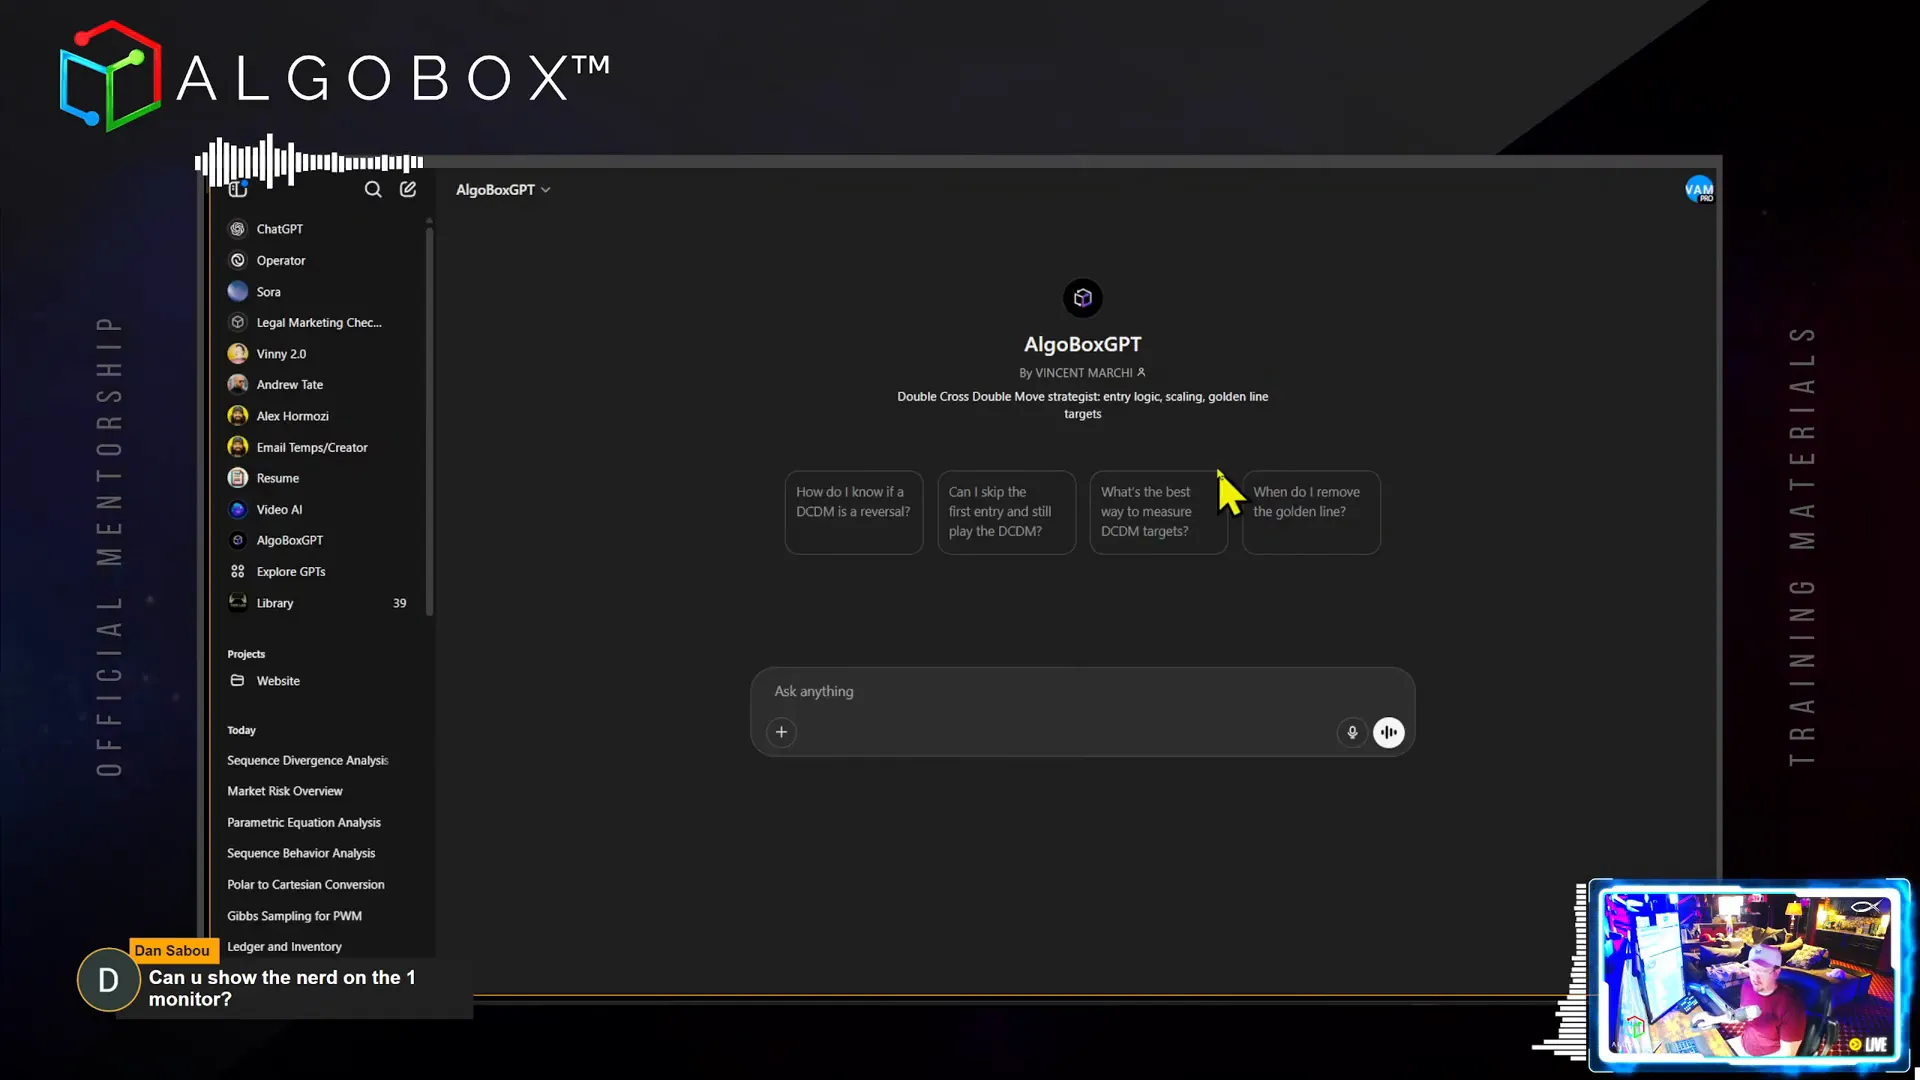
- Leverage AlgoBox GPT: Our AI-powered assistant can answer questions and guide you through features.
- Stay updated: Check premium member chat for important announcements like optimizations or market events.
- Regular maintenance: Run the provided batch file daily to clear NinjaTrader cache and improve performance.
- Practice patience: Watch live streams for examples of disciplined trading and managing trades patiently.
Step 10: Final Words and Encouragement
Trading is a skill that requires practice, discipline, and the right tools. With the AlgoBox system and NinjaTrader platform, you have access to powerful algorithmic tools and community support to help you succeed.
Remember, the individual trader now has an edge with access to technology and information that was once exclusive to institutions. Use this advantage wisely, stay patient, and keep learning.
Don’t hesitate to revisit these steps, ask questions, and engage with the community to refine your approach.
Thank you for following along with this comprehensive guide. I look forward to seeing you in the live streams and future sessions where we continue to build your trading mastery.